Example:
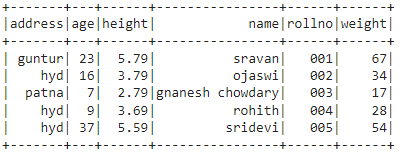
In this example, we are going to create the PySpark DataFrame with 5 rows and 6 columns and display using show() method.
import pyspark
#import SparkSession for creating a session
from pyspark.sql import SparkSession
#create an app named linuxhint
spark_app = SparkSession.builder.appName('linuxhint').getOrCreate()
# create student data with 5 rows and 6 attributes
students1 =[
{'rollno':'001','name':'sravan','age':23,
'height':5.79,'weight':67,'address':'guntur'},
{'rollno':'002','name':'ojaswi','age':16,
'height':3.79,'weight':34,'address':'hyd'},
{'rollno':'003','name':'gnanesh chowdary','age':7,
'height':2.79,'weight':17,'address':'patna'},
{'rollno':'004','name':'rohith','age':9,
'height':3.69,'weight':28,'address':'hyd'},
{'rollno':'005','name':'sridevi','age':37,
'height':5.59,'weight':54,'address':'hyd'}]
# create the dataframe
df = spark_app.createDataFrame( students1)
# display dataframe
df.show()
Output:
Scenario 1 : Get the total number of rows
We can get the total number of rows in the PySpark DataFrame using count() function.
Syntax:
dataframe.count()
Where, dataframe is the input PySpark DataFrame.
Example:
In this example, we will use count() function to get the total number of rows.
import pyspark
#import SparkSession for creating a session
from pyspark.sql import SparkSession
#create an app named linuxhint
spark_app = SparkSession.builder.appName('linuxhint').getOrCreate()
# create student data with 5 rows and 6 attributes
students1 =[
{'rollno':'001','name':'sravan','age':23,
'height':5.79,'weight':67,'address':'guntur'},
{'rollno':'002','name':'ojaswi','age':16,
'height':3.79,'weight':34,'address':'hyd'},
{'rollno':'003','name':'gnanesh chowdary','age':7,
'height':2.79,'weight':17,'address':'patna'},
{'rollno':'004','name':'rohith','age':9,
'height':3.69,'weight':28,'address':'hyd'},
{'rollno':'005','name':'sridevi','age':37,
'height':5.59,'weight':54,'address':'hyd'}]
# create the dataframe
df = spark_app.createDataFrame( students1)
# display the row count
print(df.count())
Output:
5
Scenario 2 : Get the total number of columns
We can get the total number of columns in the PySpark DataFrame using len() function with columns method.
columns method will return all the columns in a list. So, we can apply len() function to it to return the number of columns.
Syntax:
len(dataframe.columns)
Where, dataframe is the input PySpark DataFrame.
Example:
In this example, we will use len() function to get the total number of columns and display the columns using columns method.
import pyspark
#import SparkSession for creating a session
from pyspark.sql import SparkSession
#create an app named linuxhint
spark_app = SparkSession.builder.appName('linuxhint').getOrCreate()
# create student data with 5 rows and 6 attributes
students1 =[
{'rollno':'001','name':'sravan','age':23,
'height':5.79,'weight':67,'address':'guntur'},
{'rollno':'002','name':'ojaswi','age':16,
'height':3.79,'weight':34,'address':'hyd'},
{'rollno':'003','name':'gnanesh chowdary','age':7,
'height':2.79,'weight':17,'address':'patna'},
{'rollno':'004','name':'rohith','age':9,
'height':3.69,'weight':28,'address':'hyd'},
{'rollno':'005','name':'sridevi','age':37,
'height':5.59,'weight':54,'address':'hyd'}]
# create the dataframe
df = spark_app.createDataFrame( students1)
# display the column count
print(len(df.columns))
# display the columns
print(df.columns)
Output:
6
[‘address’, ‘age’, ‘height’, ‘name’, ‘rollno’, ‘weight’]
Scenario 3 : Get the Statistics
We can get the statistics like count, mean, standard deviation, and minimum value and the maximum value from the PySpark DataFrame using describe() method
Syntax:
dataframe.describe()
Where, dataframe is the input PySpark DataFrame.
Note – There is no mean and standard deviation for string type values. In that case, the result is null.
Example:
In this example, we will use describe() function to get the statistics.
import pyspark
#import SparkSession for creating a session
from pyspark.sql import SparkSession
#create an app named linuxhint
spark_app = SparkSession.builder.appName('linuxhint').getOrCreate()
# create student data with 5 rows and 6 attributes
students1 =[
{'rollno':'001','name':'sravan','age':23,
'height':5.79,'weight':67,'address':'guntur'},
{'rollno':'002','name':'ojaswi','age':16,
'height':3.79,'weight':34,'address':'hyd'},
{'rollno':'003','name':'gnanesh chowdary','age':7,
'height':2.79,'weight':17,'address':'patna'},
{'rollno':'004','name':'rohith','age':9,
'height':3.69,'weight':28,'address':'hyd'},
{'rollno':'005','name':'sridevi','age':37,
'height':5.59,'weight':54,'address':'hyd'}]
# create the dataframe
df = spark_app.createDataFrame( students1)
df.describe().show()
Output:

From the above output, name is of string type. So, null value is occupied for mean and standard deviation.
We can use summary() to return the statistics. It is similar to the describe() method. But this will return the 25%, 50% and 75% range values.
Example:
In this example, we will use describe() function to get the statistics.
import pyspark
#import SparkSession for creating a session
from pyspark.sql import SparkSession
#create an app named linuxhint
spark_app = SparkSession.builder.appName('linuxhint').getOrCreate()
# create student data with 5 rows and 6 attributes
students1 =[
{'rollno':'001','name':'sravan','age':23,
'height':5.79,'weight':67,'address':'guntur'},
{'rollno':'002','name':'ojaswi','age':16,
'height':3.79,'weight':34,'address':'hyd'},
{'rollno':'003','name':'gnanesh chowdary','age':7,
'height':2.79,'weight':17,'address':'patna'},
{'rollno':'004','name':'rohith','age':9,
'height':3.69,'weight':28,'address':'hyd'},
{'rollno':'005','name':'sridevi','age':37,
'height':5.59,'weight':54,'address':'hyd'}]
# create the dataframe
df = spark_app.createDataFrame( students1)
# get the summary
df.summary().show()
Output:

Conclusion
In this article, we discussed the use of describe() and summary() functions. They are used to return the statistics of the PySpark input DataFrame. We have seen that by using len() method we can get the total number of columns and by using count() method, we can get total number of rows in PySpark DataFrame.