[adthrive-in-post-video-player video-id=”XvhU4h2D” upload-date=”2020-05-07T18:27:32.000Z” name=”Fix high memory usage in Debian” description=”Fix high memory usage in Debian” player-type=”collapse” override-embed=”true”]
- Monitoring memory usage in Debian
- How to fix high memory usage in Debian
- Diagnosing Memory Hardware in Debian
- Related articles
The first chapter is a fast view over commands free, top, ps and /proc/meminfo, following common troubleshooting commands including cleaning the cache, killing processes and ram memory tests for hardware issues which is the less probable scenario, each command is deeply explained with examples on additional articles numerated on the Related articles section at the bottom.
Monitoring memory usage in Debian
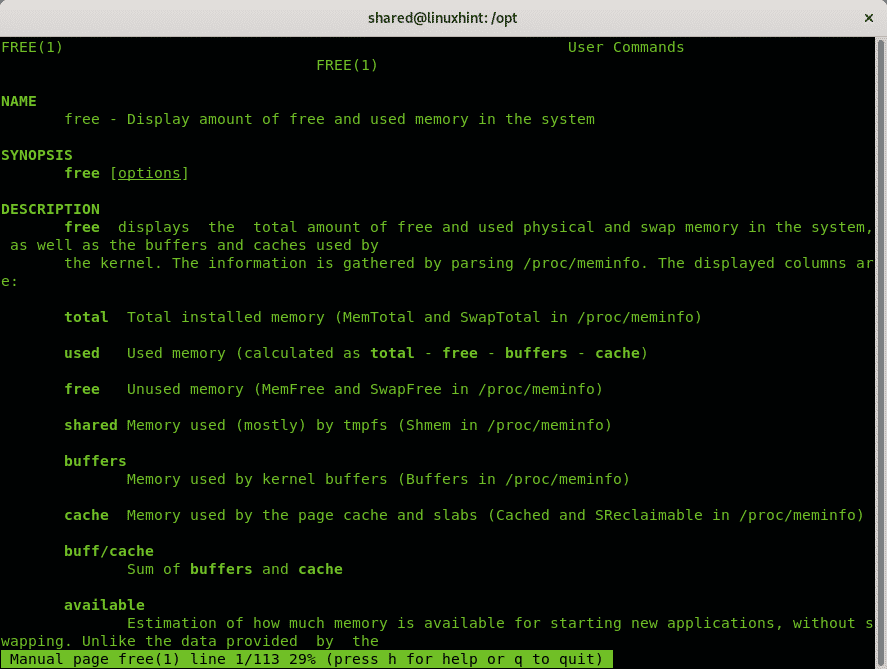
Below a list with examples of commands used to monitor the memory usage on Debian and other Linux distributions. The first command in the list is free, without parameters the default output unit is kb. To display it on the console run:
Where:
Mem: this row shows the physical ram memory
Swap: this row displays information on the virtual memory (swap)
Total: this column shows the total capability
Used: this column shows the amount of memory or swap being used
Free: the unused ram memory or swap
Shared: memory shared to be used by multiple processes
Buff/Cache: temporary store of pseudo files on memory to be used by processes
Available: the available memory for processes
To print the output in MB units use the -m flag:

Another way to check the memory usage is by reading the file /proc/meminfo, you can use the command less or open the location /proc/meminfo on a browser.
The file /proc/meminfo runs on memory and provides information on the memory use such as free, used, swap, buffers and shared memory.
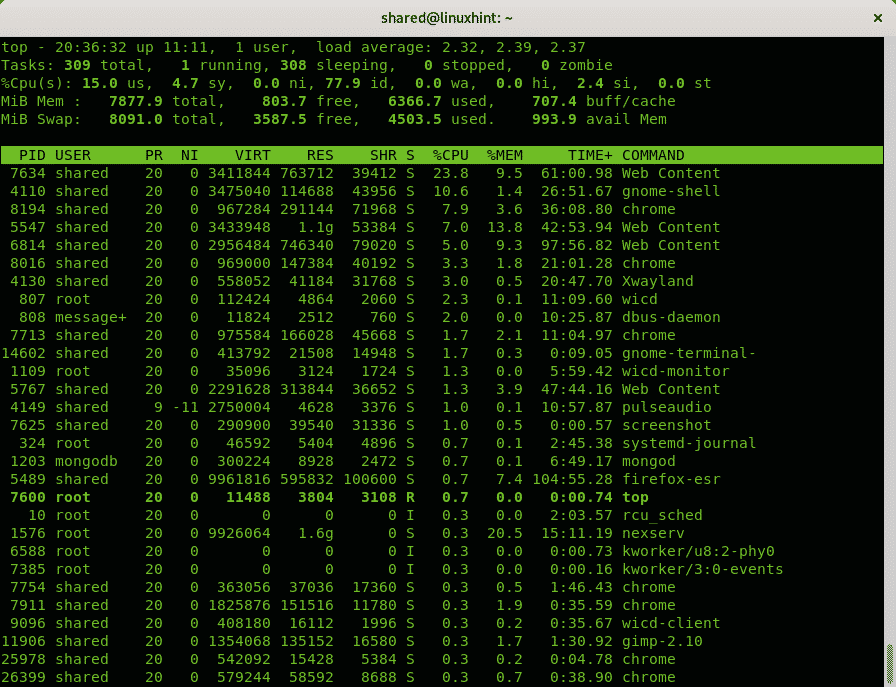
The top command allows to monitor memory usage in real time through an interactive console interface. Through it you can kill and edit the view in real time. When displaying the top interactive console you can browse between processes and select them using the keyboard arrows or kill them using the k key. The following example shows the default output for the top command without flags:
Where:
PID: this column shows the process ID number.
USER: this column shows the user who runs the process.
PR: prioriory for running processes.
NI: nice value
VIRT: Virtual Memory (Swap) being used.
RES: Physical memory used.
SHR: Shared memory used.
S: Process status.
%CPU: amount of CPU used by the process.
%MEM: amount of RAM memory used by the process
TIME+: total time the process is running.
COMMAND: the program or command which executes the process.
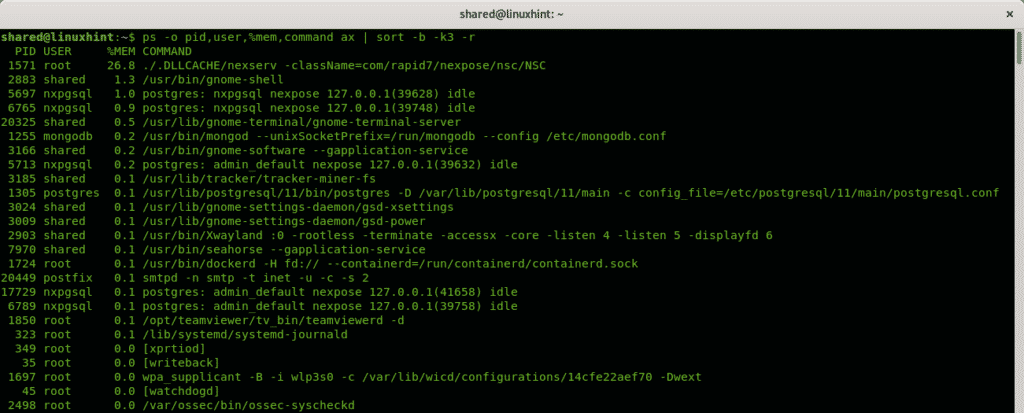
The article How to Check Memory Usage Per Process on Linux shows an interesting use of the ps command to print processes and their memory usage:
Then you can kill the process eating your memory, make sure the process doesn’t launch automatically at the startup.
How to fix high memory usage in Debian
This chapter shows some commands to solve high memory usage problems.
Before running the following steps always monitor the process status if possible by using any of the command shown previously.
Fixing high memory usage problems on Linux depends on the program the process consuming memory belongs. Usually after identifying it you can kill it or fix the problem causing the high usage.
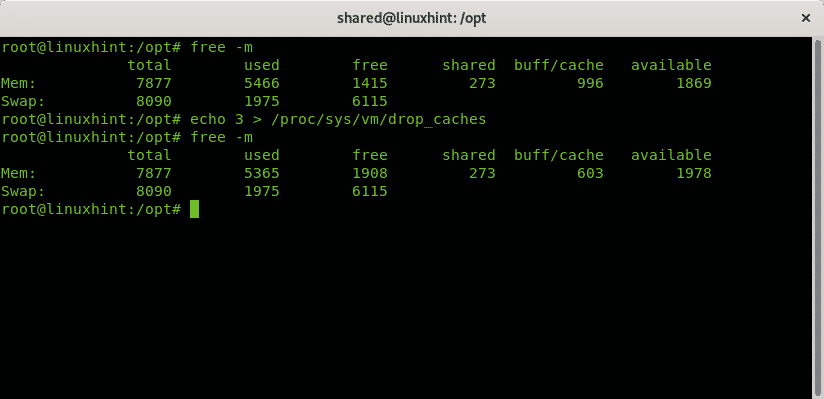
The first command shows how to release memory from the cache, you can see the comparison of the free -m output before and after running the command:
As you can see in the free -m executed before and after the command the buff/cache column shows a decrease from 996 to 603 and additional memory became available.
Testing Memory Hardware in Debian
This chapter shows how to analyze your ram memory for hardware issues.
The optimal way to test the ram memory is by booting the computer using the memtester feature instead of the OS granting Memtest greater access to the memory. When executed from the OS the effectivity decreases. To install memtester on the console run:

The following tests are from the original version, updated simply for speed and rewritten to fit the new framework of the program. These tests will mainly catch memory errors due to bad bits which are permanently stuck high or low:
Random Value
Compare SUB
Comprate MUL
Compare DIV
Compare OR
Compare AND
The following tests were implemented by me, and will do a slightly better job of catching flaky bits, which may or may not hold a true value:
Solid bits
Block Sequential
(source https://github.com/jnavila/memtester/blob/master/README.tests)
I hope you found this tutorial on fixing high memory usage on Debian useful. Keep following LinuxHint for more tips and updates on Linux and networking.


