This tutorial explains how to enable core dump in Linux.
After reading this tutorial you will be able to check if core dump is enabled, how to enable or disable it, how to view, and more.
Core dump files are used to diagnose and debug software crashes.
A core dump is a non-structured registry of the memory content containing information on the execution of software abnormally terminated, including the reason for the crash.
In other words, this is a snapshot of the program state with the execution and termination process recorded. You can think about core dump as an airplane black box or a logs file.
Core dump management may vary from a Linux distribution to other, this tutorial is optimized both for Debian based Linux distributions like Ubuntu, and RedHat Linux distributions like CentOS.
All instructions included in this article contain screenshots, making it easy for every Linux user to understand and follow them.
Enabling Core Dump in Linux
The first step is to check if core dump is enabled. For this purpose, use the following command. If the core file size is 0, as in the example below, then core dump is disabled.
To enable core dump in Linux, with unlimited size, use the following command. Then, execute the previous command you will see the 0 is replaced with unlimited.
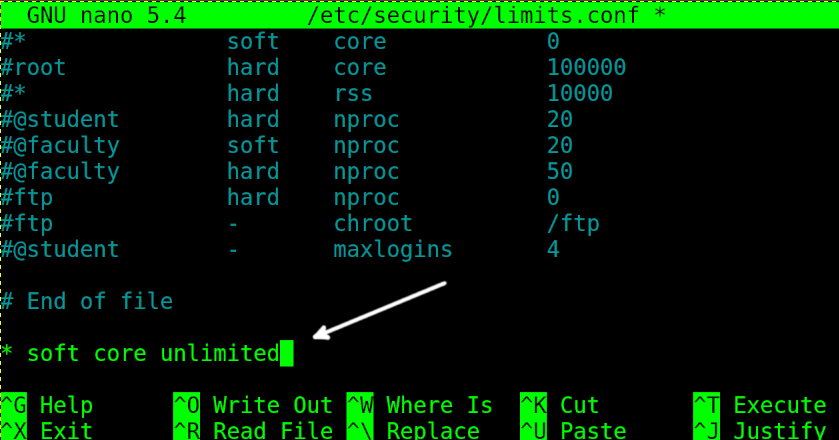
To enable core dump permanently, you need to edit the file /etc/security/limits.conf. Open it with privileges using any text editor.
Then, add the following line and close saving changes:
Now, let’s try to execute an application programmed to crash intentionally.
As you can see in the screenshot below, the core dump was generated.
According to the default configuration on Debian based Linux distributions, the core dump should be created in the current directory. You can check this by executing the following command:
As you can see in the previous figure, the core dump was properly generated.
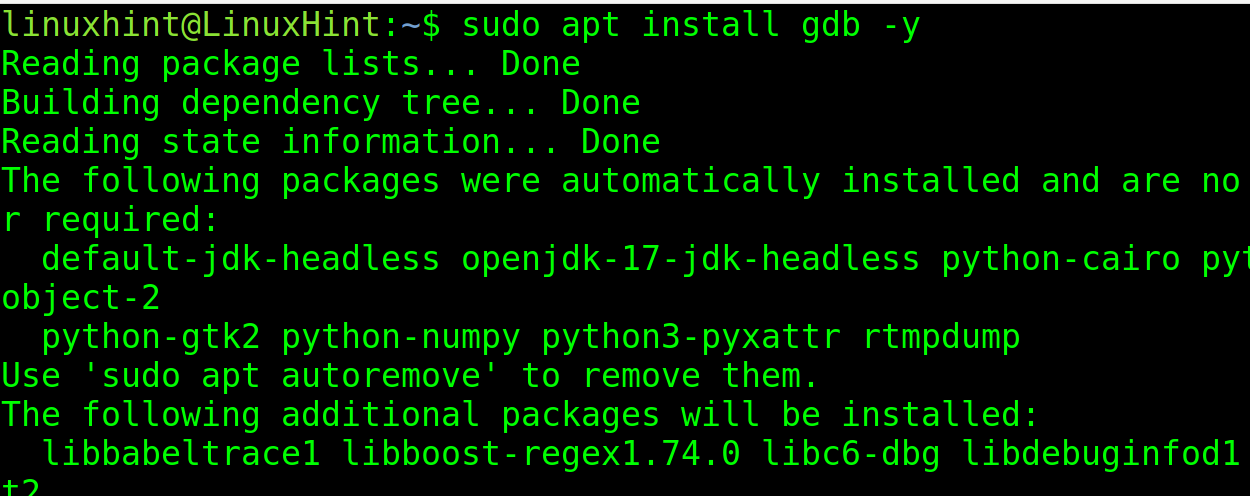
To view it, you need to install the GNU Debugger. You can install it using apt as shown in the image below.
Note that RedHat based systems users must use Automatic Bug Reporting Tool (ABRT) instead of GDB.
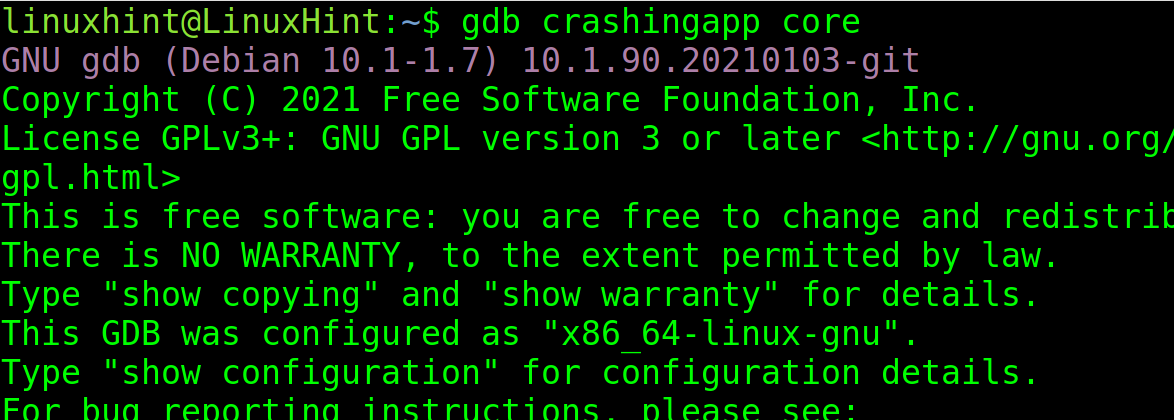
To view the core dump files, use the following syntax:
In my case I run:
You will be asked to press “c” to continue. Press it and you will see the report.
By default, core dump files are called core.
You can change the name and destination patterns to identify core dumps easily.
The command is the following:
-%u will include the User ID in the core dump name. The -%g will include the Group ID and %p the PID.
As you can see, after executing the crashing app again, a new core dump is generated including UID, GID and PID.
There are additional values you can use to define core dump patterns. You can find them in the list below.
| VALUE | Function |
|---|---|
| %<NUL> | ‘%’ is dropped |
| %% | output one ‘%’ |
| %p | Includes PID |
| %P | Includes Global PID |
| %i | Shows Thread ID |
| %I | Global Thread ID |
| %u | User ID |
| %g | Group ID |
| %d | Dump mode |
| %s | Signal number |
| %t | UNIX time of dump |
| %h | Hostname |
| %e | Executable file |
| %E | Executable file path |
You also can define a core dumps directory to store them.
The syntax is the following:
“/cored” is the directory where core dumps will be stored. This names will include both PID and Global PID.
As you can see, after running the crashing app, the core dump was stored in the /cored directory including both PID and GPID.
How to Disable Core Dumps in Linux
Disabling core dump is so simple as enabling them.
Just set the limit to 0 by running the following command:
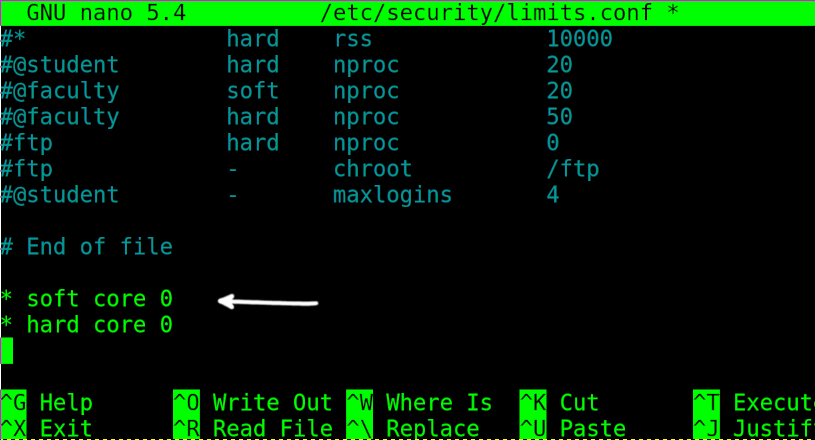
To permanently disable core dump, edit the /etc/security/limits.conf file using any text editor as shown in the figure below.
Add the following 2 lines, then exit saving changes.
* hard core 0
Finally, check if core dump was successfully disabled by executing the following:
As you can see the core file size limit is 0, core dump is disabled.
Conclusion
Core dumps can be very helpful for debugging procedures and identifying failures. Becoming familiar to them is recommended to improve problems response. They also can be useful to capture data freed by dynamic memory, fetching information on no longer running programs. They also can be helpful for programmers to find errors. A core dump can save the state of a process at a defined state to return to it later. It can also be dumped onto a remote host over a network (which is a security risk).


