Elasticsearch can be called a NoSQL database, a Big Data solution, or a Search engine like Google. It is used to search a simple document to make a complex search engine that can work with complex queries. It collects log data and inserts it in the log files to keep track of all the activities on Elasticsearch.
This guide contains the following sections:
Does Elasticsearch Have a User Interface?
Yes, inserting and collecting data from the database can be done through simple queries from the terminal using Elasticsearch. However, the user needs to view the pictorial representation of the data to get a clearer picture of the data and the information coming from it. It does require a user interface which is called Search UI that is provided by the Kibana:
What is Elastic Enterprise Search?
Companies mostly rely on data that is coming in huge numbers like employee data, customers data, and so on. They need to manage that data and gain information from it. It can be stored in warehouses to make better decisions. Elastic Enterprise search allows the user to access the information using creative dashboards that can be designed using the Kibana tool.
How to Configure and Use Kibana?
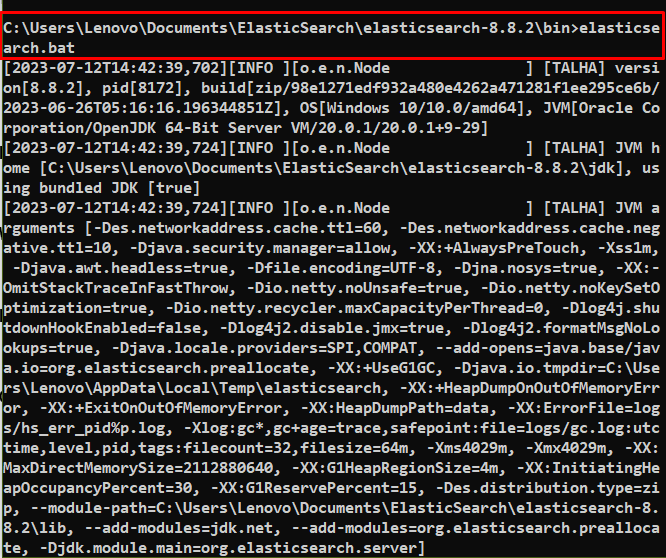
To configure and set up the Kibana, it is required to start Elasticsearch first using the following command inside the “bin” directory:
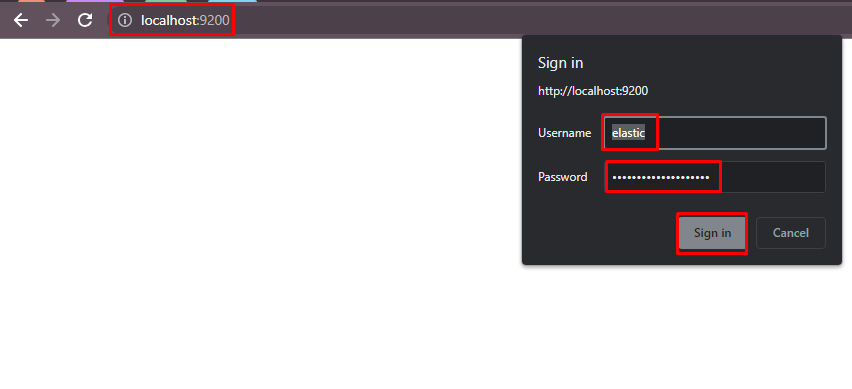
After running Elasticsearch from the command prompt, simply use the following address on the web browser to sign into the engine:
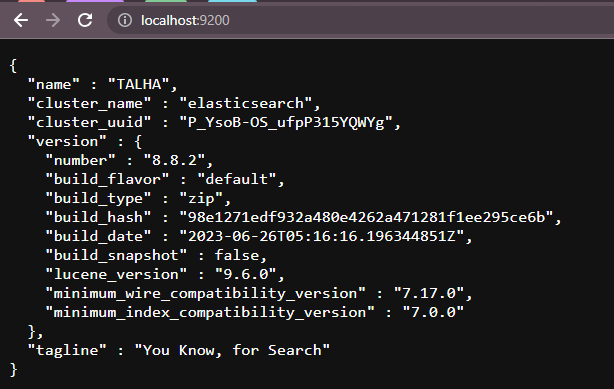
The following screenshot displays the connection through localhost using the 9200 ports:
Connect to Kibana
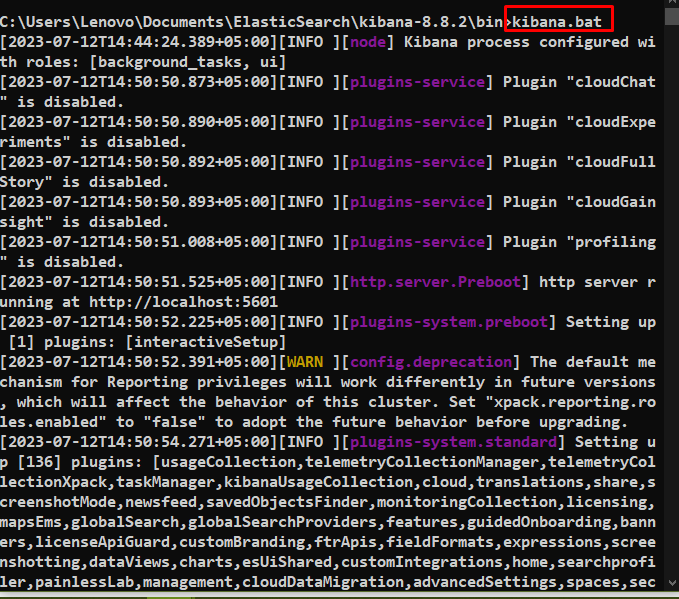
After that, open the terminal from the Kibana’s bin directory to use the following command:
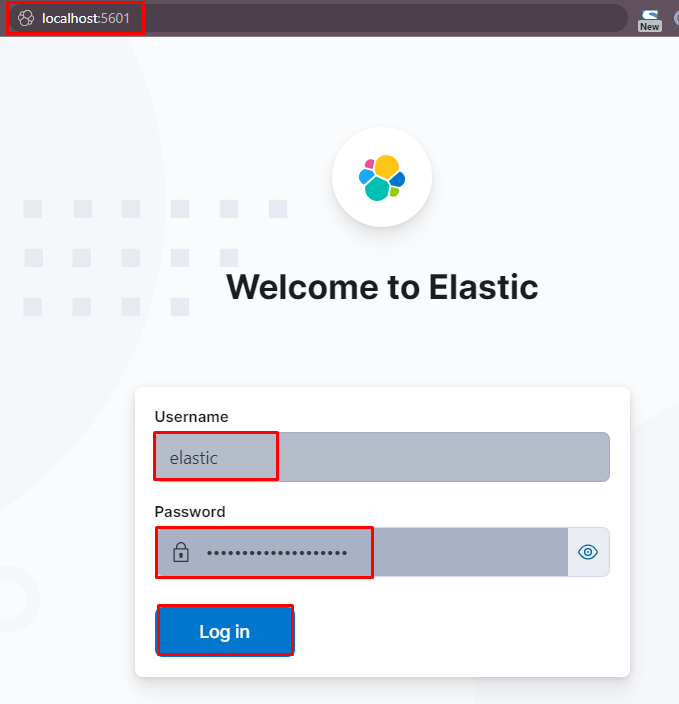
Run the Kibana on the web browser on localhost using the port number 5601 and log in to the user interface:
Overview of Kibana UI
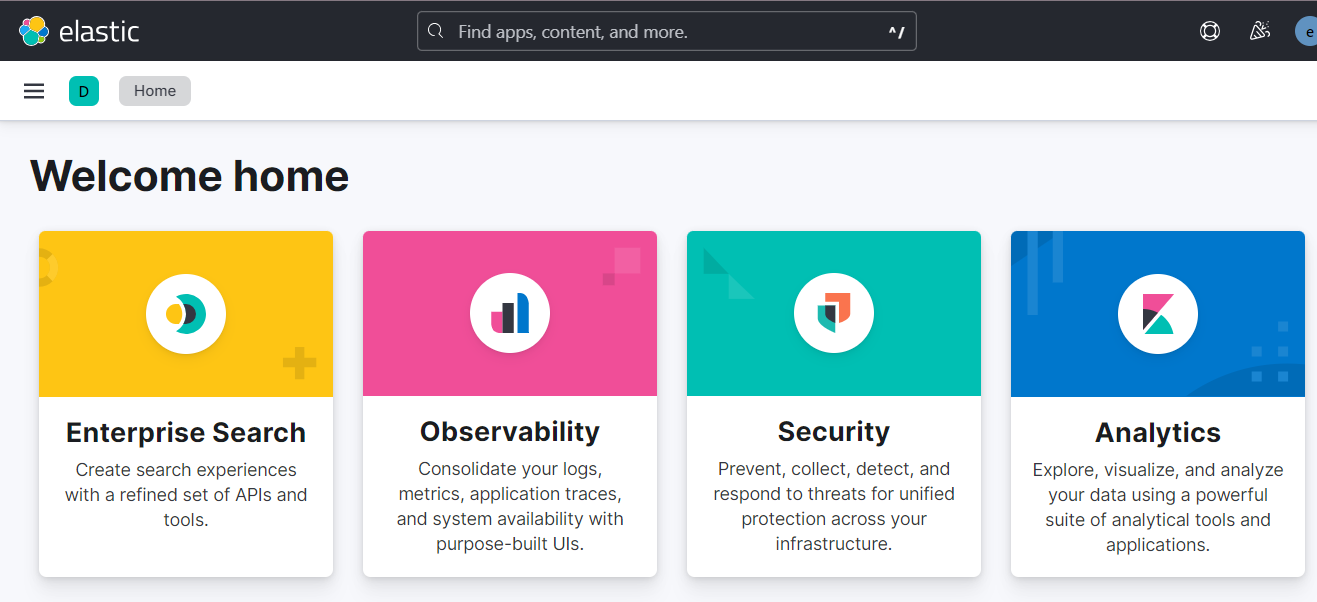
On the Welcome page of the Kibana UI, the following sections are available to be used:
-
- Enterprise Search
- Observability
- Security
- Analytics
The user can create integrations from the Home page as well to use the sample data provided by the platform or upload their data from the directory:
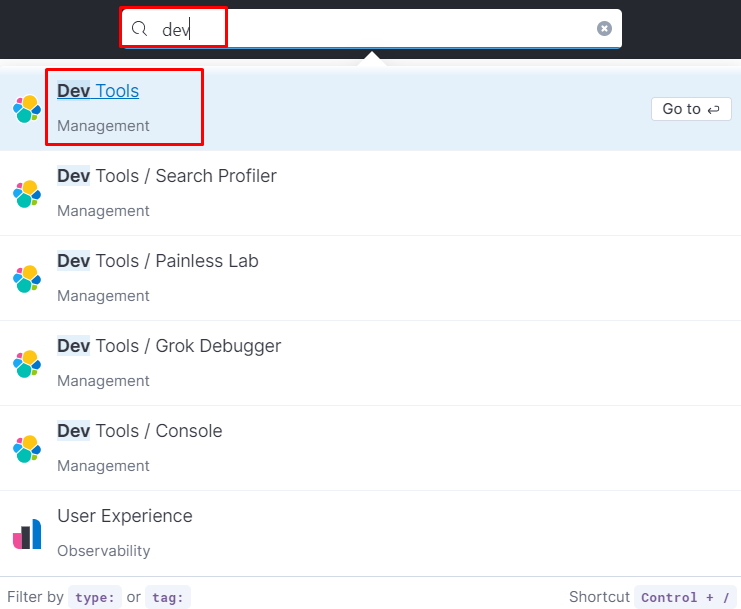
Search the Dev Tools to visit its console from the Kibana page:
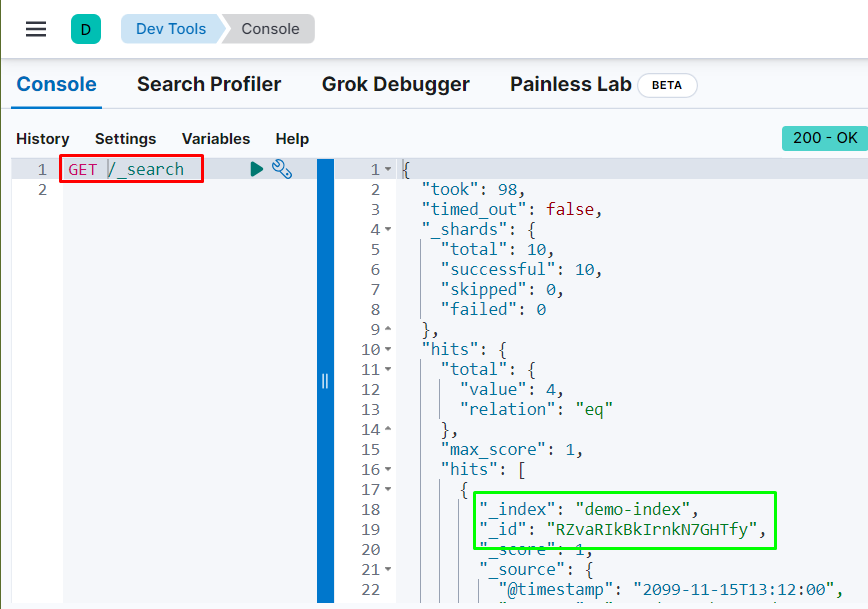
Use the following command on the Dev Tool console to get the data stored on the Elasticsearch database:
The following screenshot displays the data from the Elasticsearch user with Search API:
That is all about the user interface of Elasticsearch with the Kibana tool.
Conclusion
Elasticsearch is a search engine that allows companies to get useful insights from the data stored in the analytics database. To get graphical representations of the data, there is a need for the user interface which can be used through the Kibana tool. The user can simply set up Kibana with Elasticsearch and use it via queries and fetch data from the database. This guide has explained the user interface of Elastic search and the process of configuring it on localhost.


