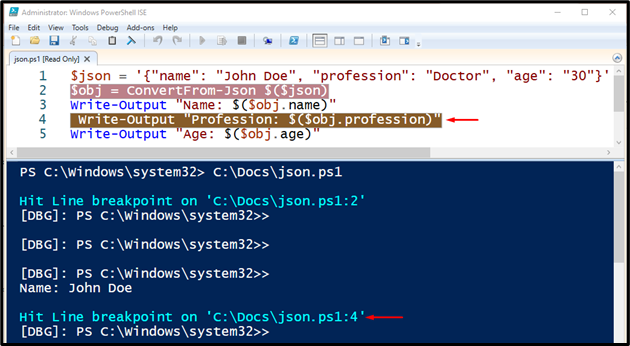
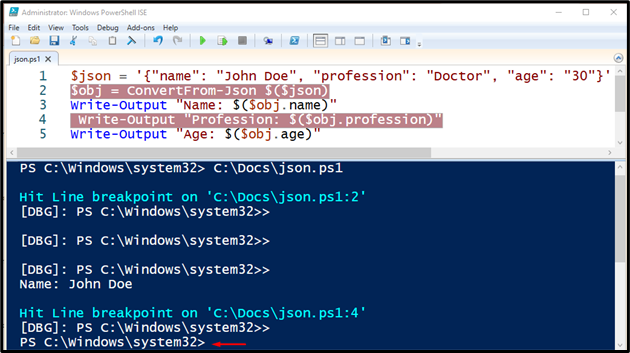
In this guide, the procedure of debugging a script in PowerShell ISE will be illustrated.
How to Debug Scripts in Windows PowerShell ISE?
Debugging is the procedure of detecting and resolving the errors in a PowerShell script. In order to debug a PowerShell script, follow the below-given steps.
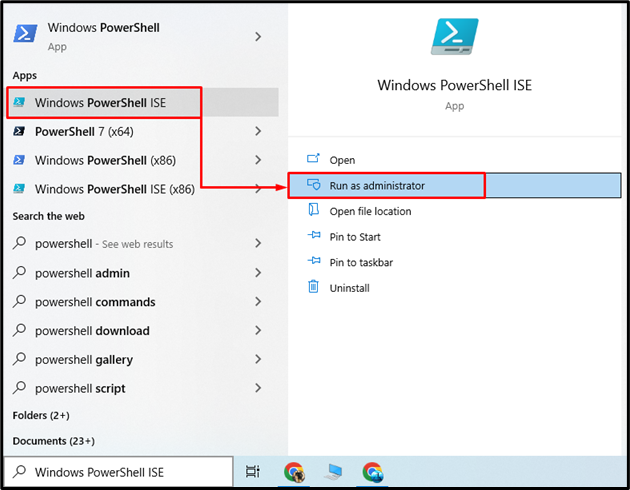
Step 1: Launch PowerShell ISE
First, navigate to the “Startup” menu and open PowerShell ISE:
Step 2: Set Breakpoints
Set the breakpoints to pause the execution at specific points. For this particular purpose:
- First, open the PowerShell script.
- Next, move the mouse cursor to the line that needs to set a breakpoint
- Then, trigger the “Debug” button, and click “Toggle Breakpoint” or press the “F9” button:
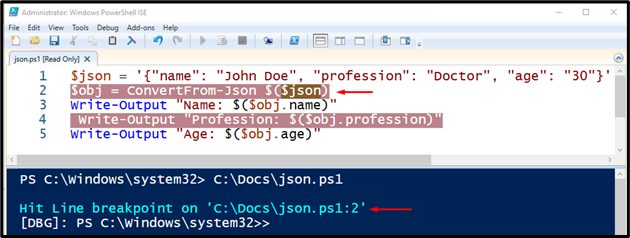
Step 3: Start Debugging
To start debugging, run the opened script by pressing the “F5” key:
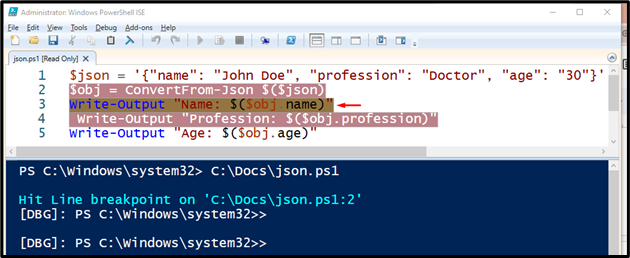
Step 4: Step into Code Using “F11” Key
Use the “Step Into” option that exists inside the “Debug” menu or press the “F11” key to execute the next line of code:
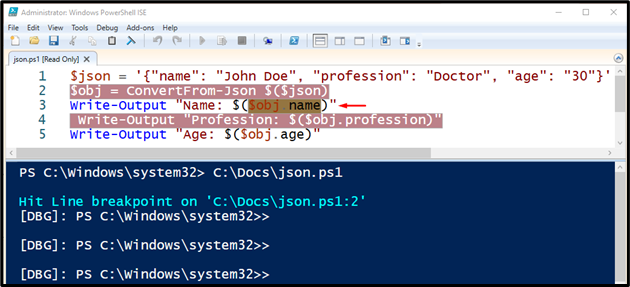
Or:
Use the “Step Over” option or press the “F10” key to run the next variable and skip over any functions or subroutines:
Step 5: Step Out of Code Using “Shift + F11” Key
To execute the remaining lines of the current function, go to the “Debug” menu and click on the “Step Out” option or press the “Shift + F11” keys:
Step 6: Stop Debugging Using “Shift + F5” Keys
Once you have finished debugging process, hit the “Debug” menu and select the “Stop Debugger” option or press the “Shift + F5” keys to exit debug mode:
That’s all! You have successfully learned the method of debugging a script in Windows PowerShell ISE.
Conclusion
To debug a script in Windows PowerShell ISE, simply run the script by pressing the “F5” key. Debugging a script helps to identify and correct the errors that occur while running a script. This guide has elaborated on the debugging of the script comprehensively in Windows PowerShell ISE.

