Thus, scorecards allow you to track the performance of your business or organization by displaying important metrics and their current status in a clear and easily understandable format. Also worth noting is that each KPI or metric is typically represented by a single-value visualization, often in the form of a card.
Power BI scorecards empower decision-makers to swiftly assess the health of your business operations, track progress toward goals, and drive informed actions by condensing complex data into easily understandable visuals.
This article outlines how to create scoreboards in Power BI.
Creating Power BI Scoreboards
Creating Power BI scorecards is an essential aspect of leveraging the platform’s capabilities for effective data visualization and business intelligence. If you are looking to create a Power BI scoreboard, the following steps will help;
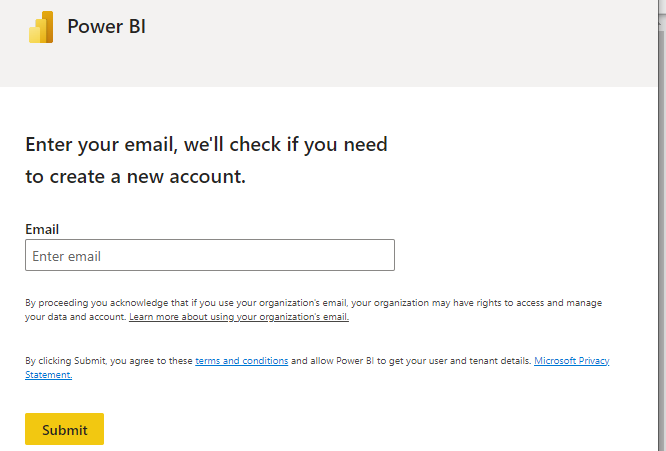
Step 1: Sign in to the Power BI Service
Firstly, you must sign in to the Power BI service if you want to create Power BI scoreboards and manual metrics. You can sign in with your work account at app.powerbi.com.
Step 2: Define KPIs
Now, define critical KPIs and metrics that align with your organization’s objectives. These could encompass financial performance, sales targets, customer satisfaction ratings, or any other quantifiable measures that drive success.
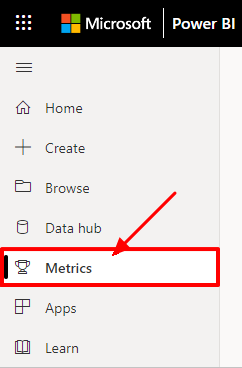
Step 3: Select Metrics
In your Power BI, go to the Metrics hub and click it. You can find this at the navigation pane that is available at the left side of the Power BI dashboard.
Step 4: Create a New Scoreboard
Clicking on the Metrics hub will provide you with options to review your existing scoreboards or create new ones. Click on the new scoreboard option, and once it opens, proceed to populate it with relevant metrics.
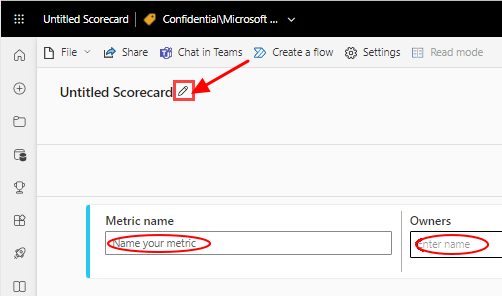
Step 5: Name Your Scoreboard
By default, your new scoreboard will appear as an untitled scoreboard. Edit this and provide a name for your scoreboard by clicking on the pencil icon as shown in the image below. You can also define the ownership if the scoreboard if necessary.
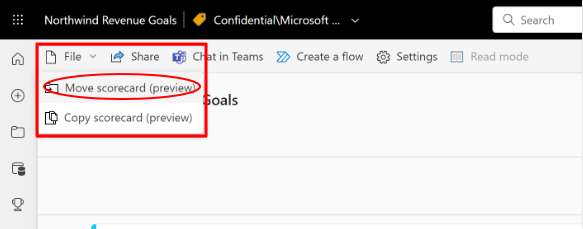
Step 6: Save the Scoreboard
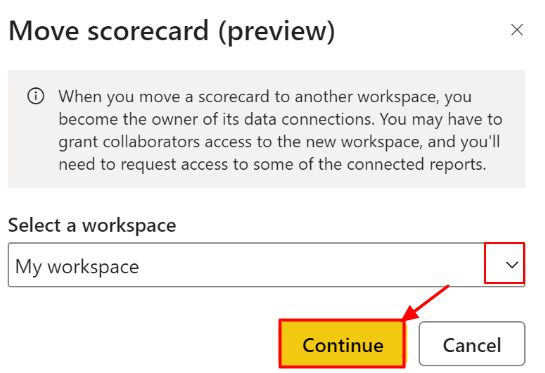
With all the details set, Power BI will automatically save your scoreboard in the My Workspace section. But you can still choose to move your scoreboard to any of your workspaces. To achieve this, click on the File pane and choose move scoreboard.
Step 7: Save in a New Dashboard
A new dialogue box will appear. Here, you can either select a workspace from any of your already created workspaces or create a workspace if you do not have any. Specify the workspace and press Continue.
Power BI will save your scoreboard in the workspace of your choice. This will include your scoreboard and all the associated dataset.
Step 8: Design and Create Visualizations
You can now use your scorecards to create visualizations by choosing the appropriate visualizations for your data. Here are some of the visualizations that you can use scorecards to create:
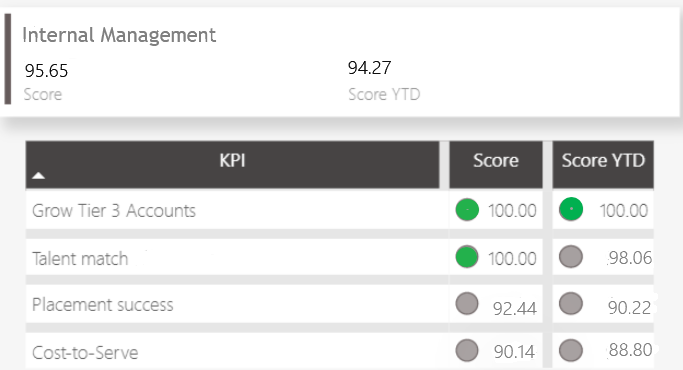
a. Cards
You can use the Card visualization to display individual KPI values. Interestingly, cards are formattable to show the desired value, target, and other relevant information. Cards is a single-value visualization. Thus, you can use it to display the current status of each KPI as illustrated in your scorecard.
b. Bullet Charts
You can also visualize your scorecards as a bullet chart. For example, a bullet chart visual will look like what we have in the figure below:
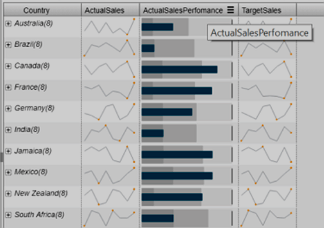
The two are just a few examples of how you can create visuals for your scorecards and enable actionable insights. You can also create bar charts, line charts, pie charts, tree maps, and many more. You have the convenience of choosing the kind of visualization that meets your needs.
Conclusion
That brings us to our tutorial on Power BI scorecards. You can use them to create simpler and more interactive ways to monitor and communicate the most important metrics and KPIs within your data. Besides, you can use them to identify trends and make proactive decisions as desired.