Table of Contents:
- Prerequisites
- Installing Grafana on Ubuntu 20.04 LTS
- Accessing Grafana for the First Time
- Adding Prometheus Data Source on Grafana
- Creating a Dashboard for Network Monitoring
- Setting Network Monitoring Dashboard as Default
- Conclusion
- References
Prerequisites:
To try out the examples of this article, you must have Prometheus and Node Exporter installed on your computer.
If you need any assistance installing Prometheus and Node Exporter on your Ubuntu 20.04 LTS distribution, check out the article How to Install Prometheus on Ubuntu 20.04 LTS.
Installing Grafana on Ubuntu 20.04 LTS:
To be able to graph data from Prometheus using Grafana, you must have Grafana installed on your computer. Grafana is not available in the official package repository of Ubuntu 20.04 LTS. But, you can download a DEB package of Grafana from the official website of Grafana and install it on Ubuntu 20.04 LTS.
First, update the APT package repository cache with the following command:
Grafana depends on the adduser and libfontconfig1 packages.
To install the Grafana dependency packages, run the following command:
The Grafana dependency packages should be installed on your Ubuntu 20.04 LTS computer if they are not installed already. In my case, the adduser and libfontconfig1 packages are installed.
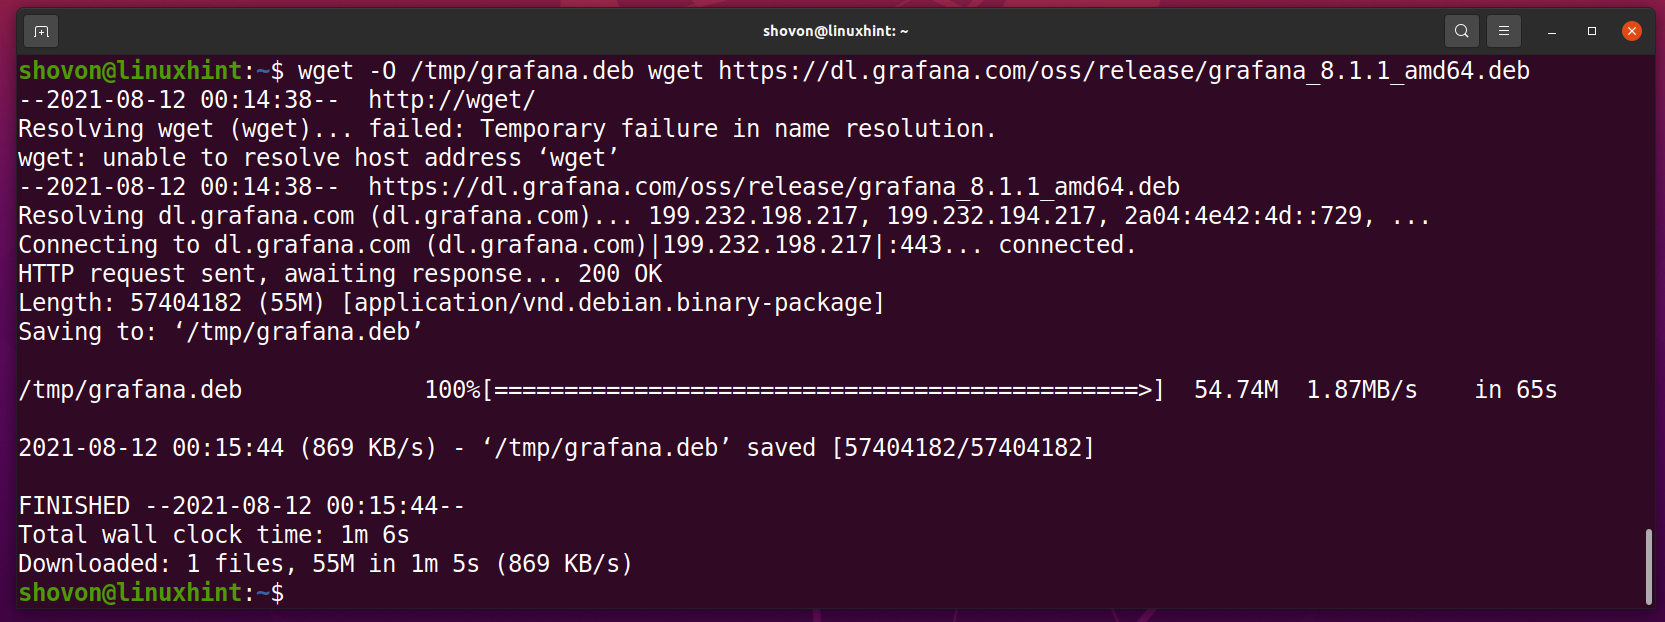
To download the DEB package file of the latest version of Grafana (v8.1.1 at the time of this writing) and save it in the /tmp directory as grafana.deb file, run the following command:
The Grafana DEB package file is being downloaded. It may take a while to complete.
At this point, the Grafana DEB package file should be downloaded.
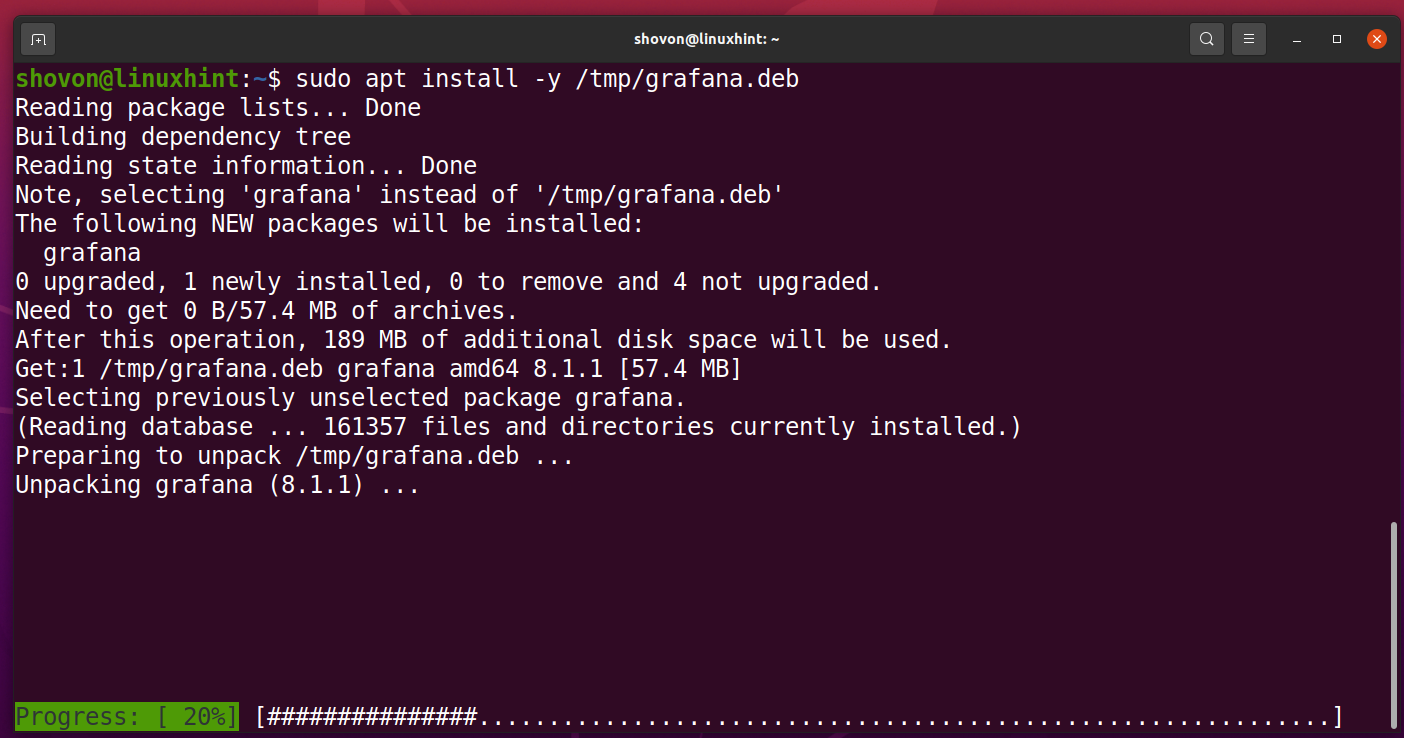
Now, install the Grafana package grafana.deb with the following command:
Grafana package grafana.deb is being installed.
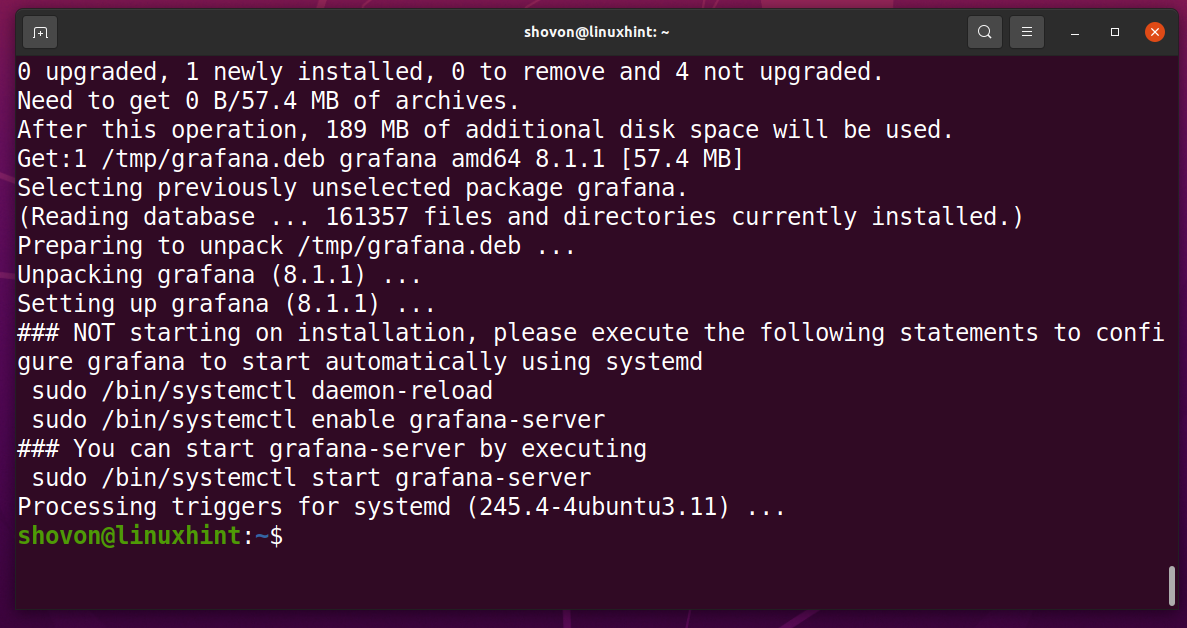
Grafana should be installed at this point.
Now, reload the systemctl daemons with the following command:
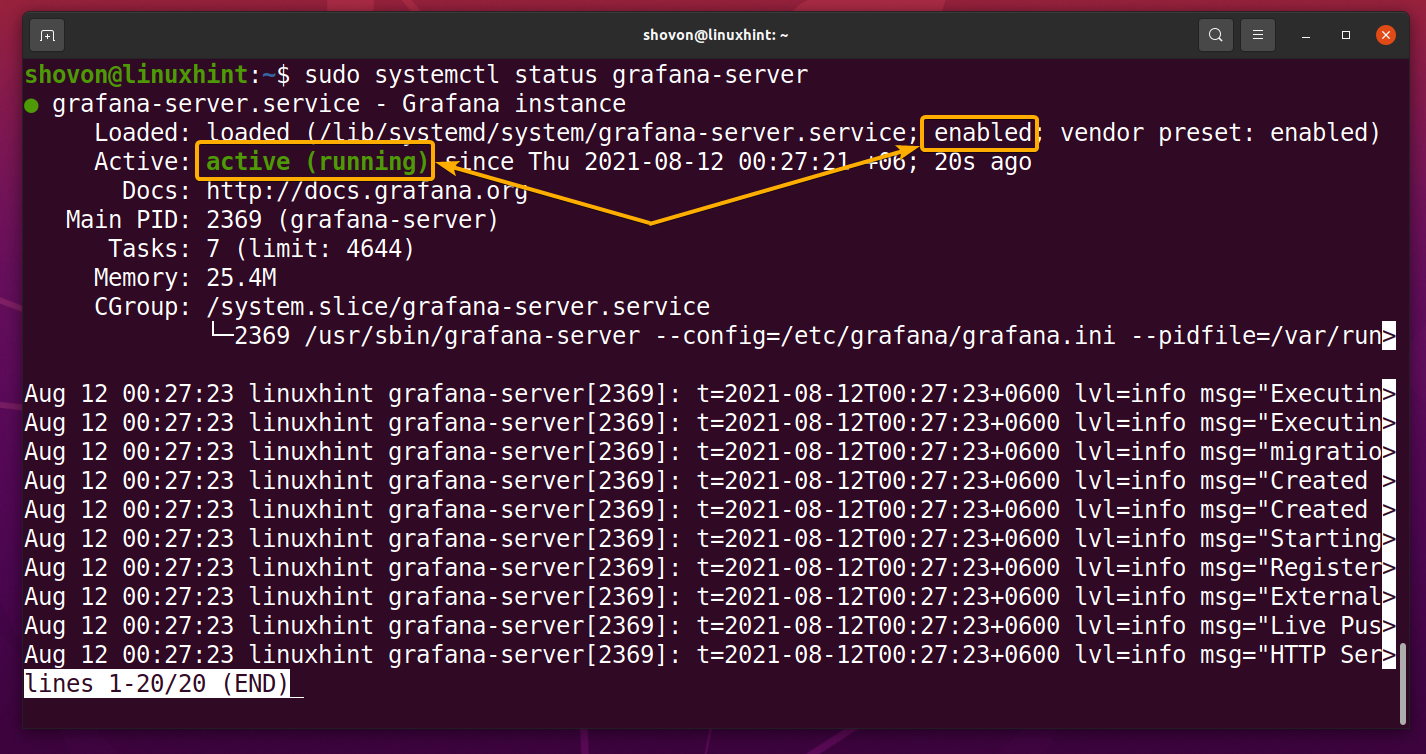
Start the grafana-server systemd service and add it to the system startup so that it starts automatically at boot time with the following command:
As you can see, the grafana-server systemd service is running, and it’s enabled.
Accessing Grafana for the First Time:
Once you’ve installed Grafana, you have to access Grafana from a web browser and set up an admin account.
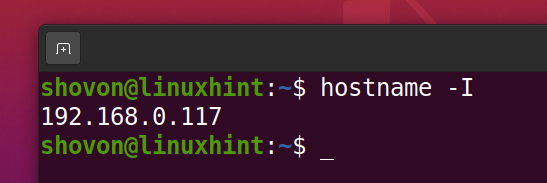
First, you have to know the IP address of the computer where you have installed Grafana.
In my case, the IP address is 192.168.0.117. It will be different for you. So, make sure to replace it with yours from now on.
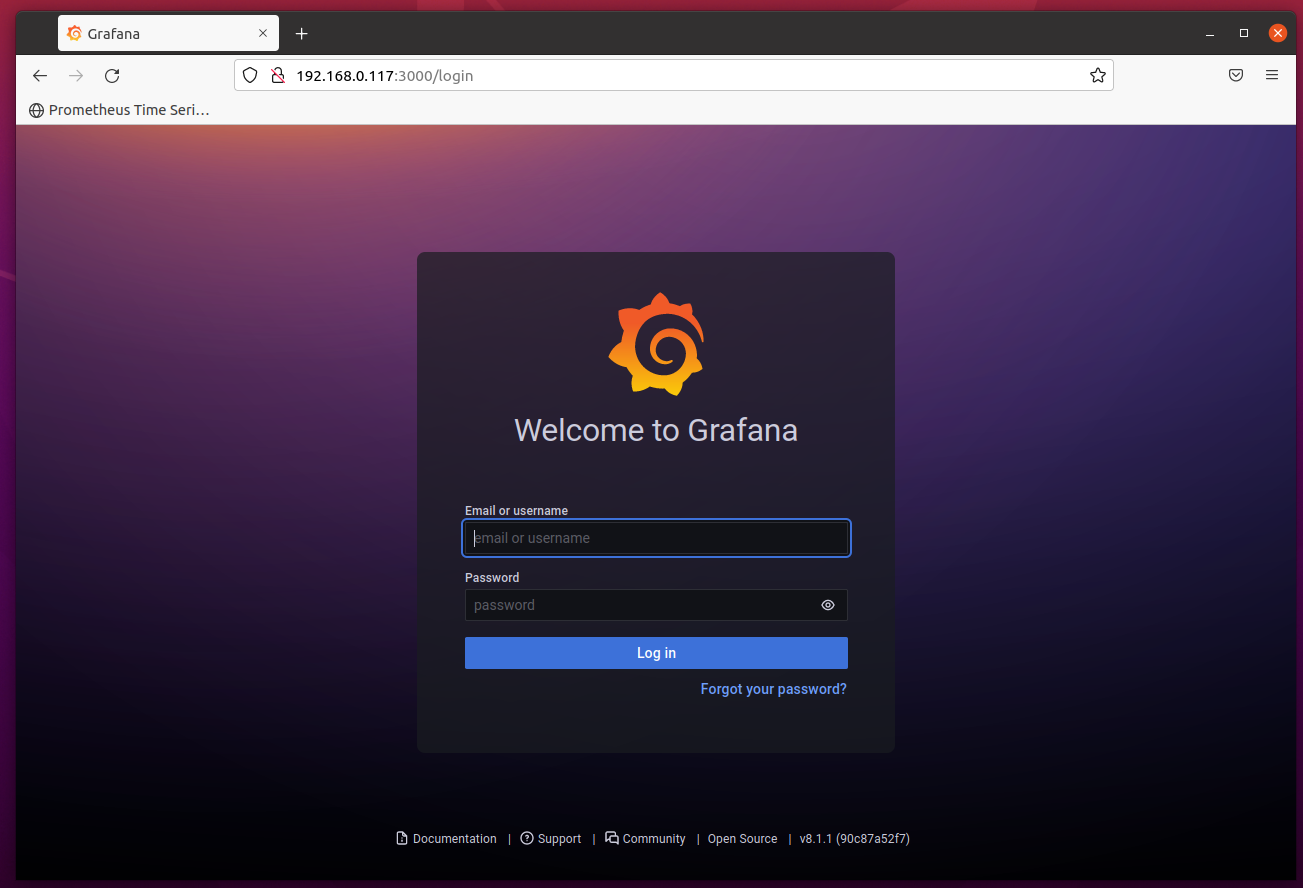
Now, open a web browser and navigate to the URL http://192.168.0.117:3000 and you should see the Grafana log-in page as in the screenshot below.
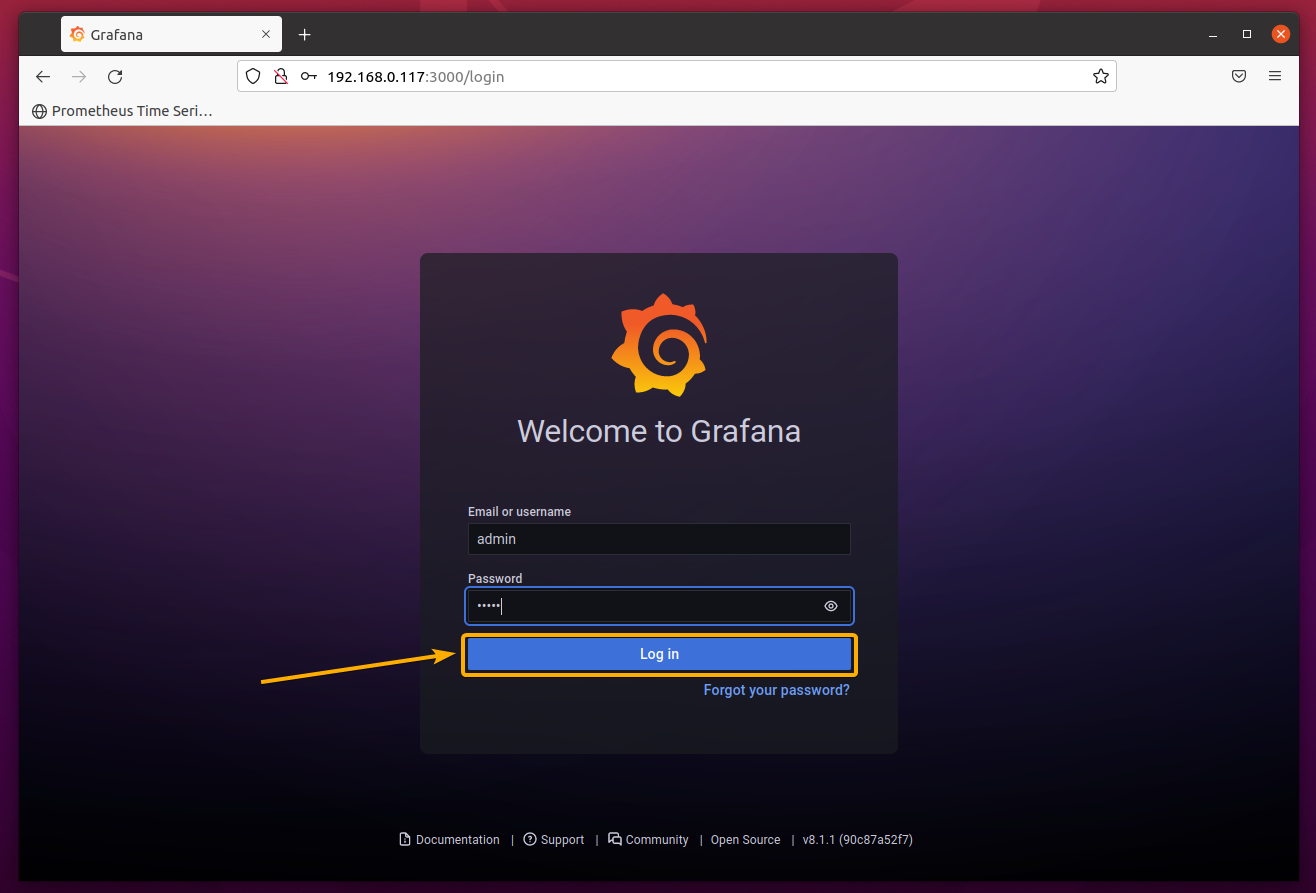
The default admin account username is admin, and the password is also admin.
Type in admin as the username and admin as the password and click on Log in.
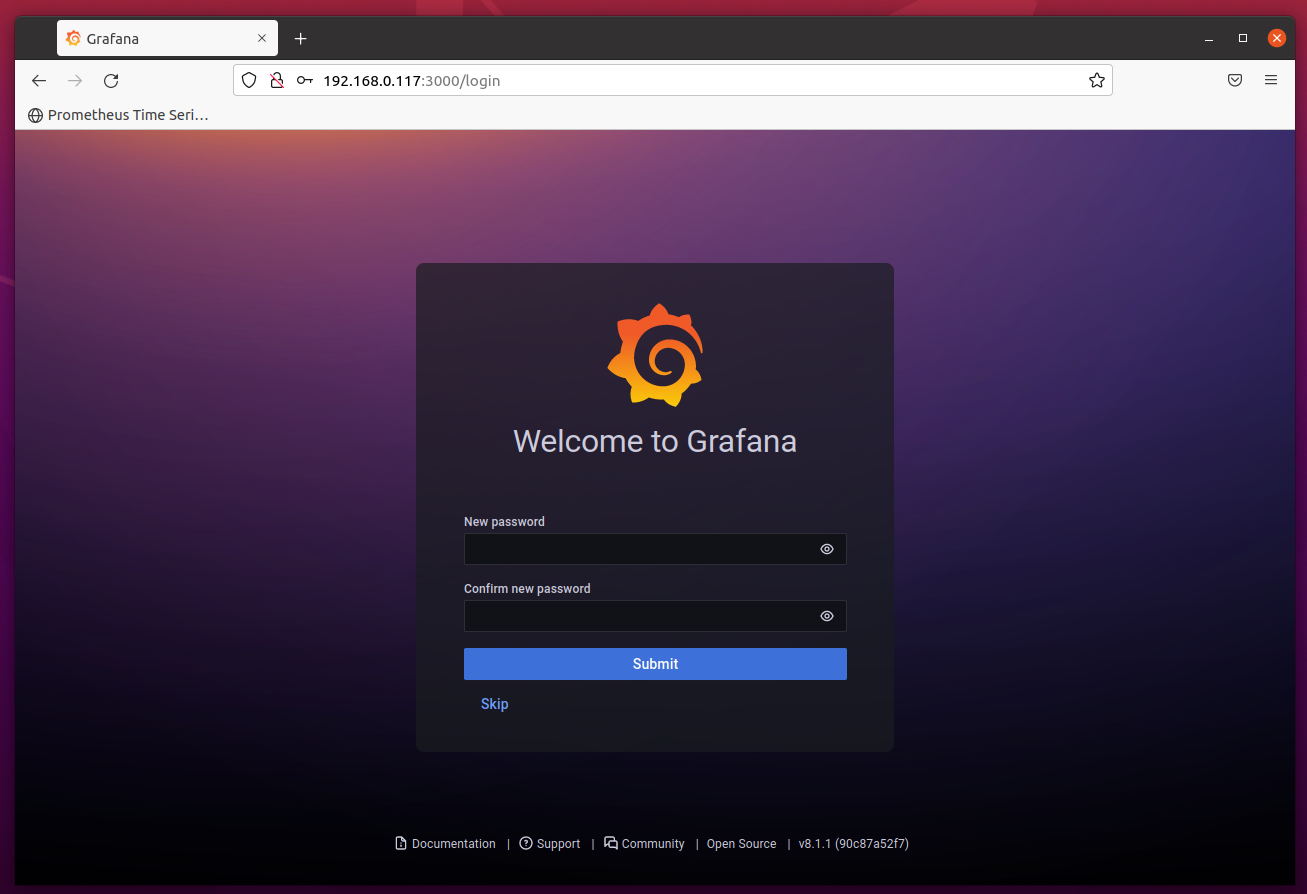
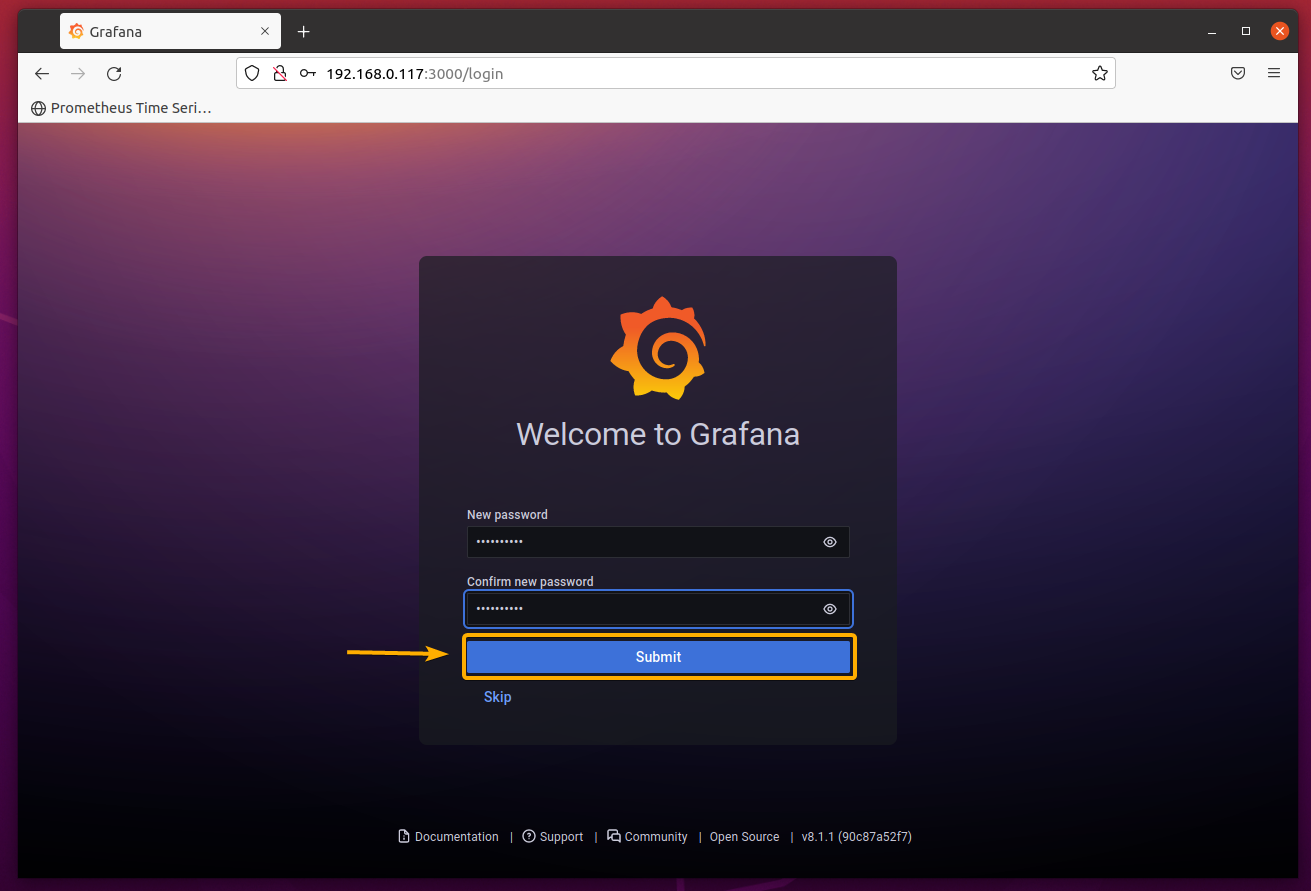
As you’re logging in to Grafana for the first time, you will be asked to set a new admin password.
Type in a secure admin password and click on Submit.
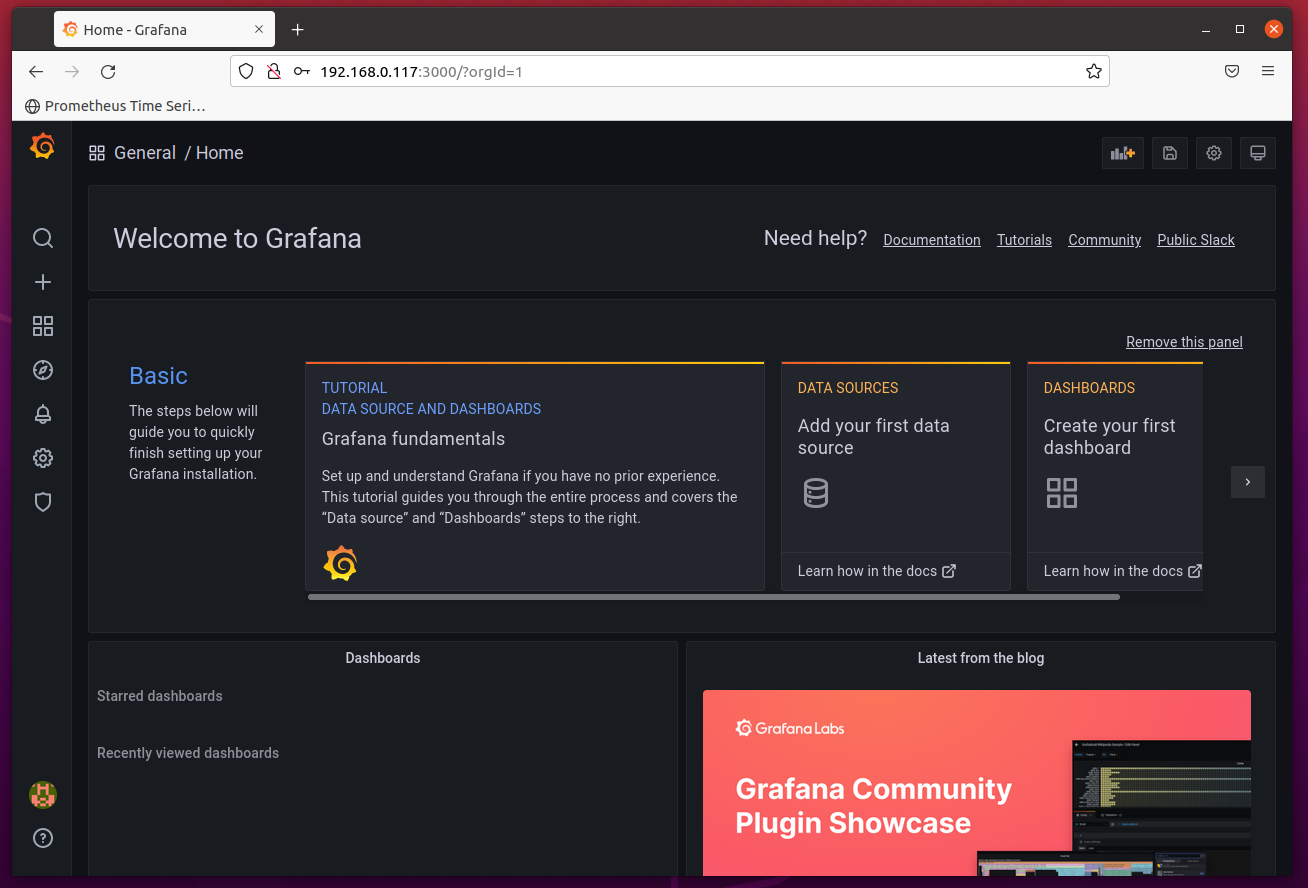
The admin password should be updated, and you should be redirected to the default Grafana dashboard page, as shown in the screenshot below.
Adding Prometheus Data Source on Grafana:
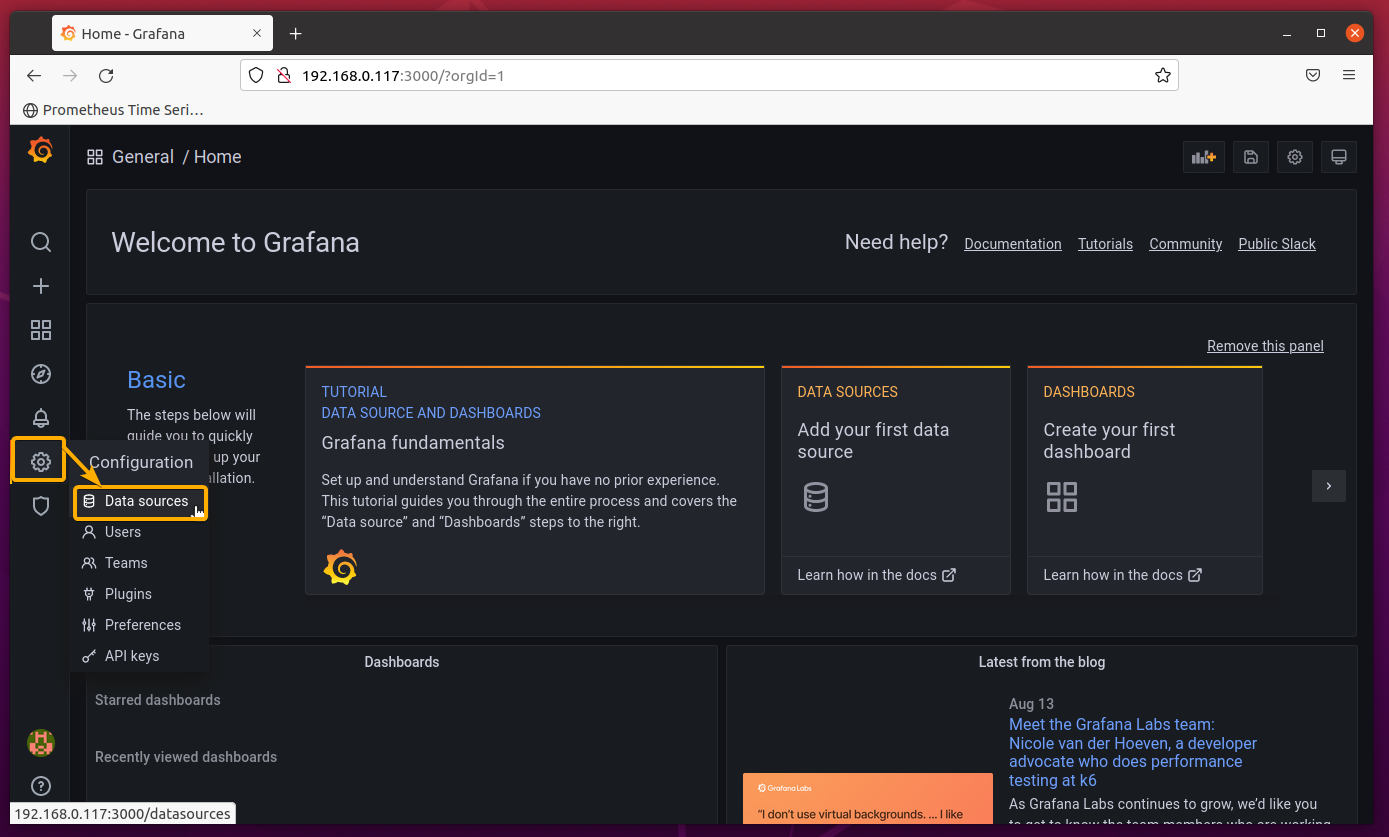
To add Prometheus as a data source on Grafana, click on Configuration () > Data sources as marked in the screenshot below.
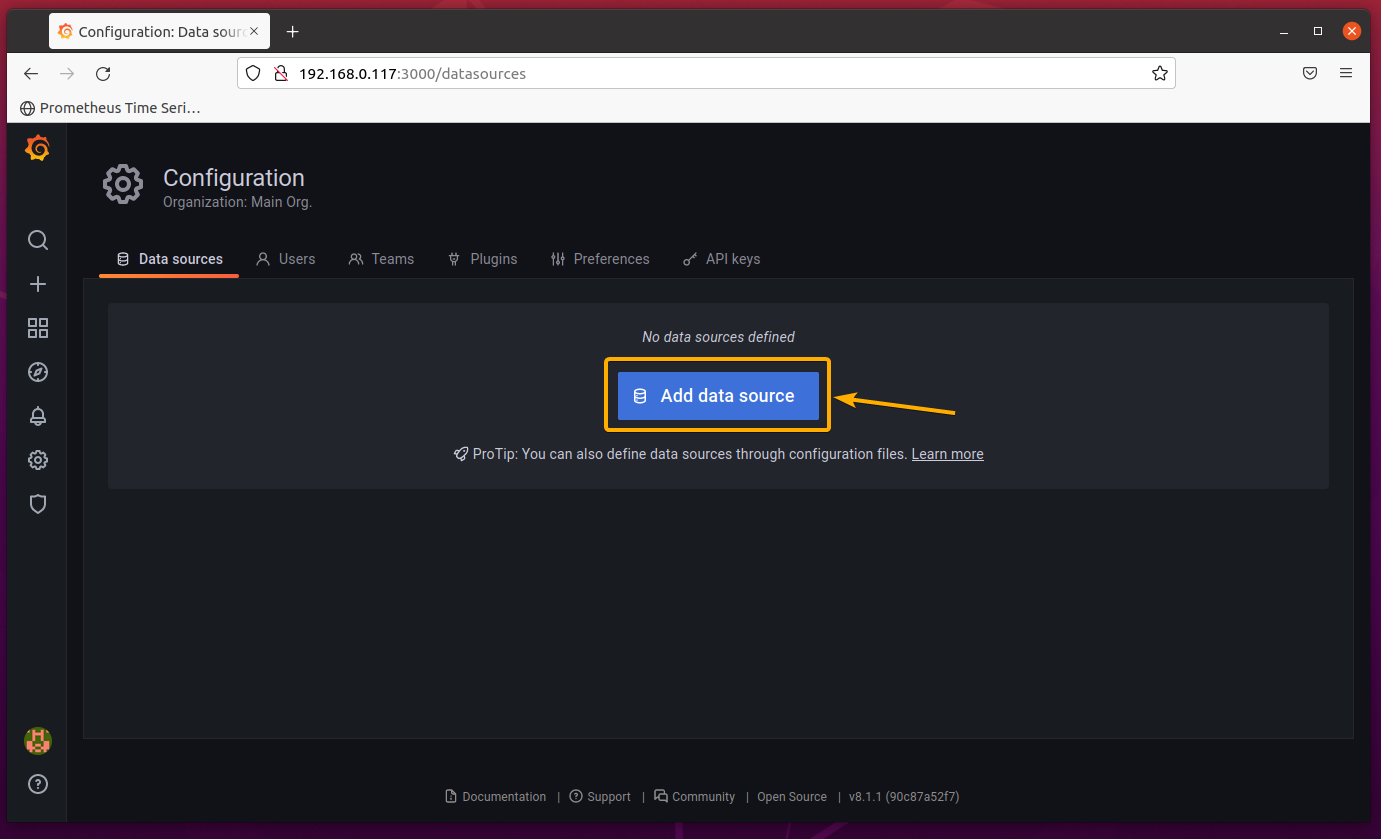
Click on Add data source.
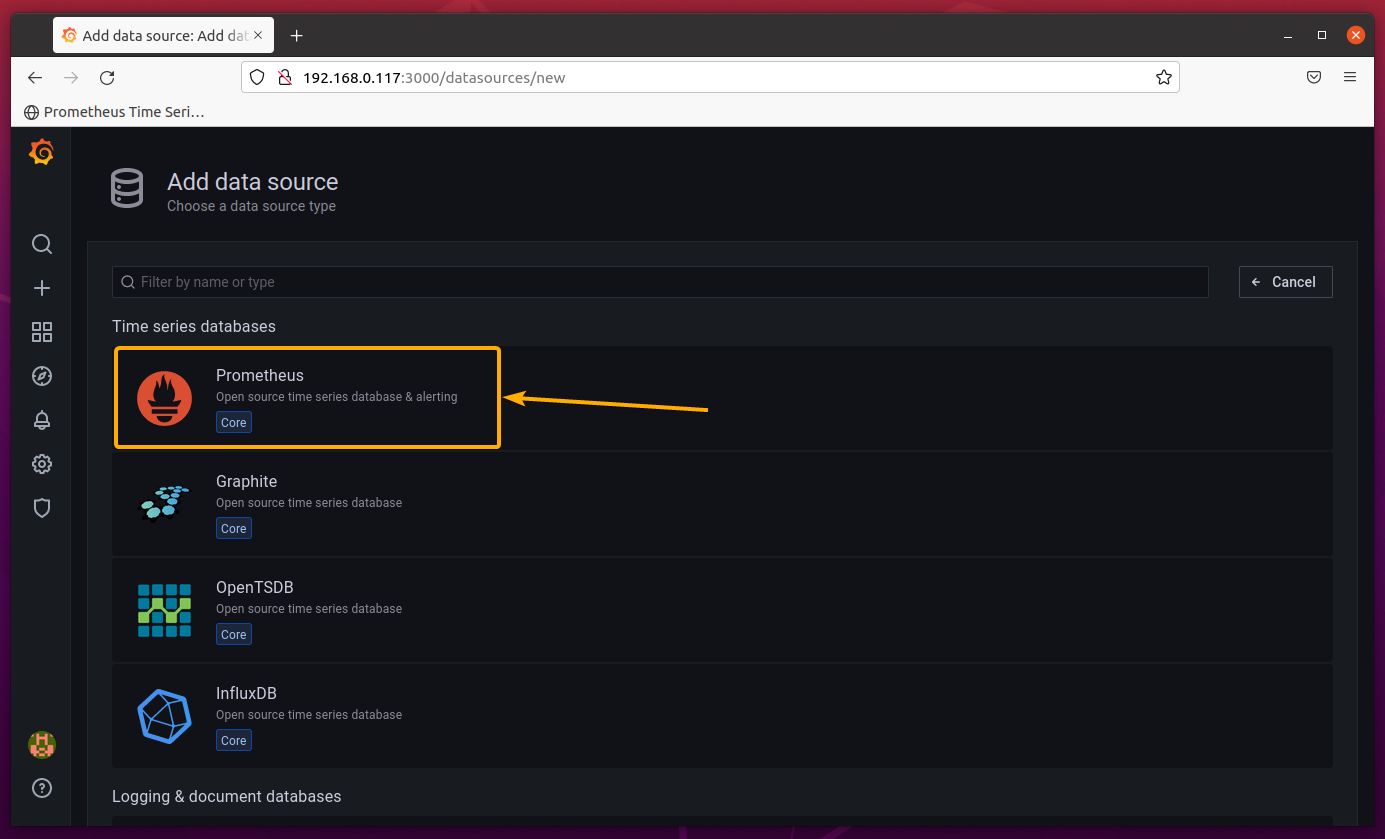
Click on Prometheus.
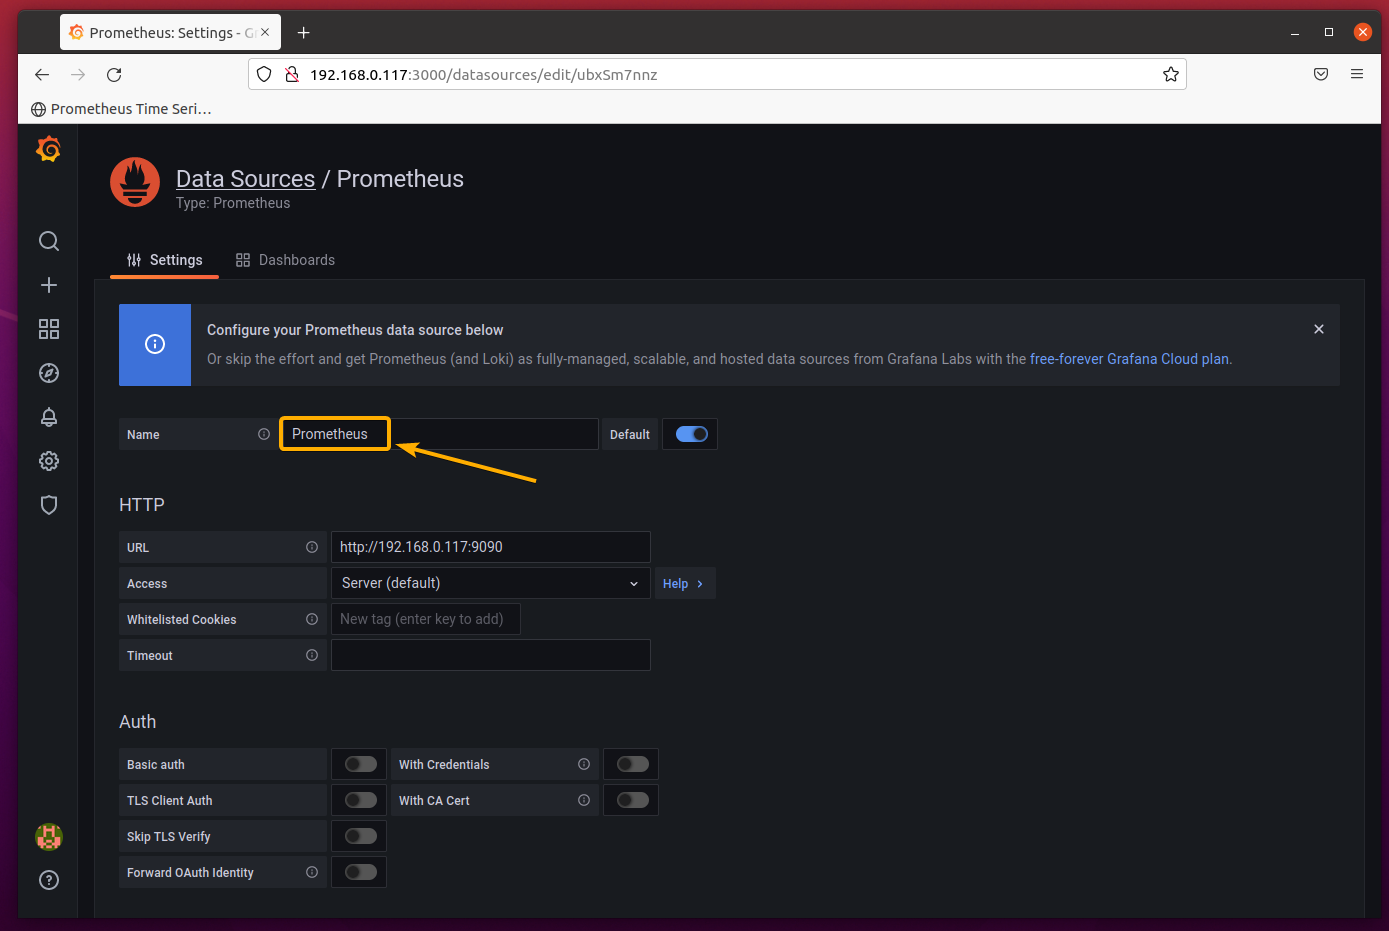
Set a name for the Prometheus data source. I will call it Prometheus. You can call it anything you want.
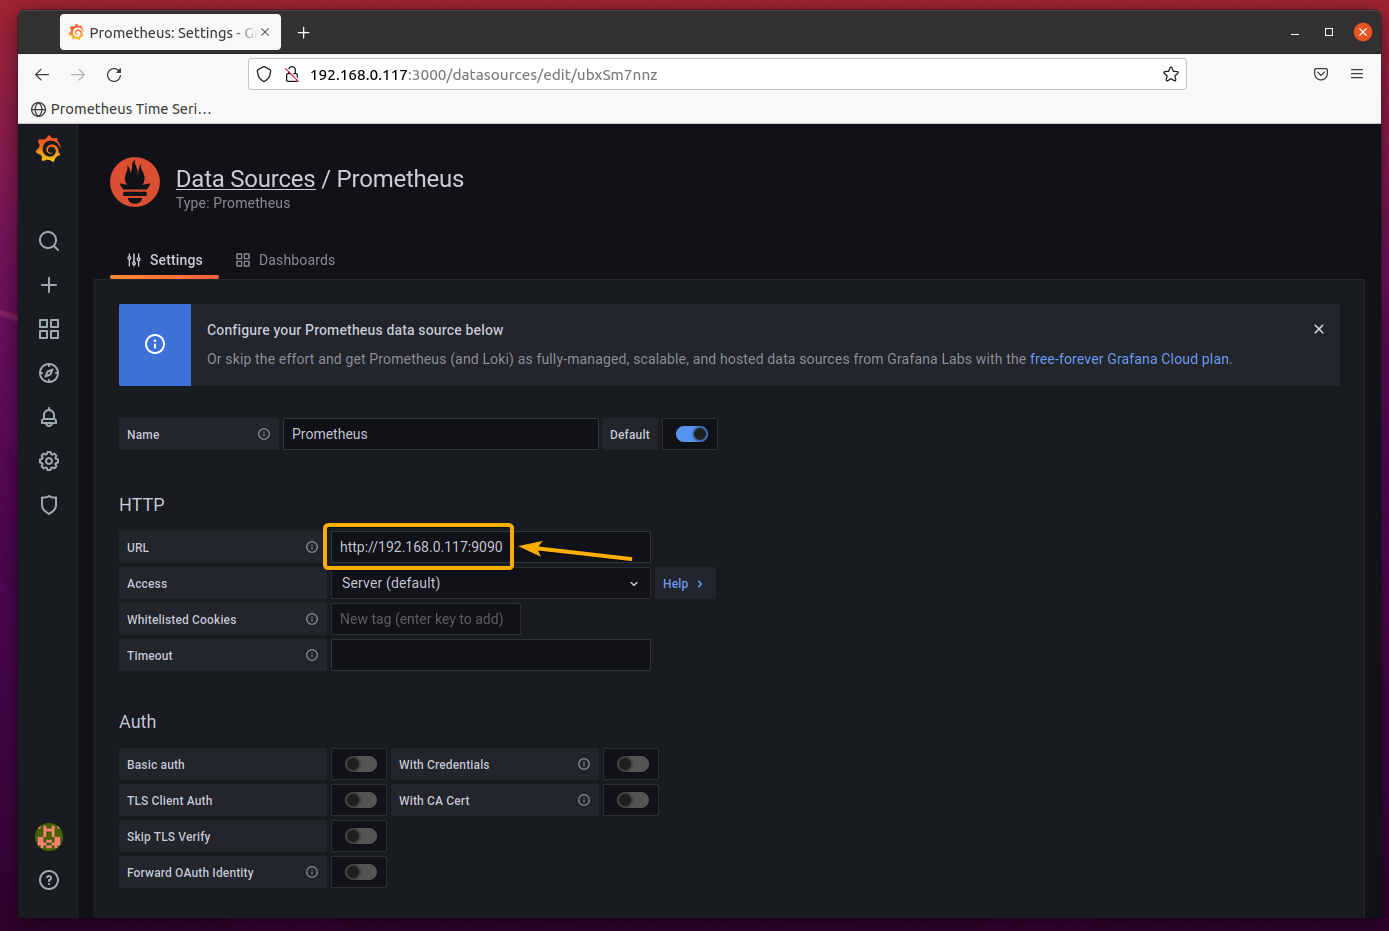
Now, type in http://192.168.0.117:9090 as the URL.
Here, 9090 is the port that Prometheus runs on, and 192.168.0.117 is the computer’s IP address where Prometheus is installed. Change the Prometheus port number in the URL if you’re running Prometheus on another port. Also, replace the IP address with the IP address of the computer where you have Prometheus installed.
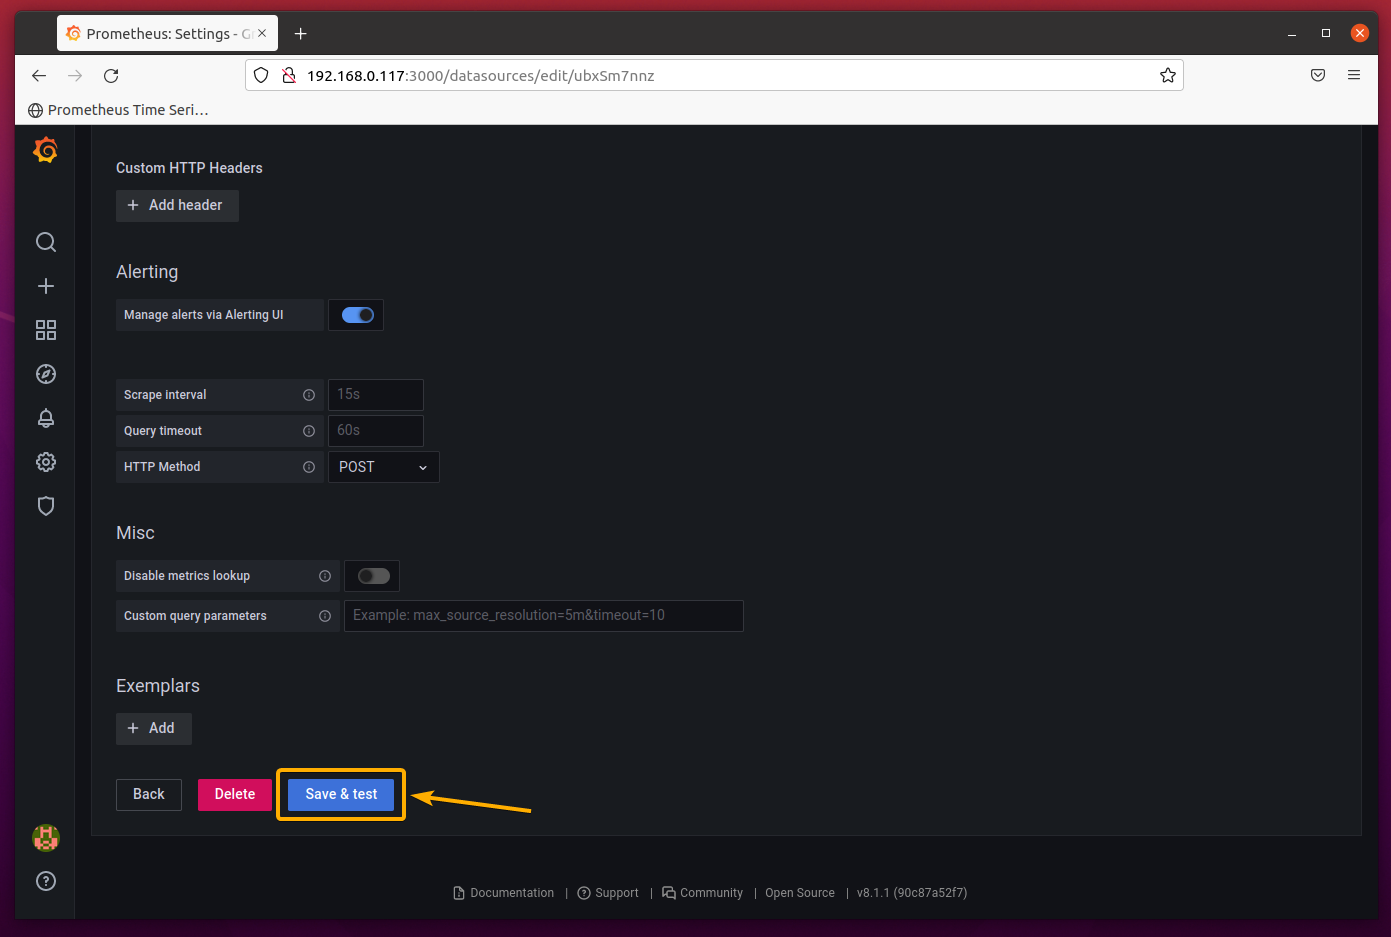
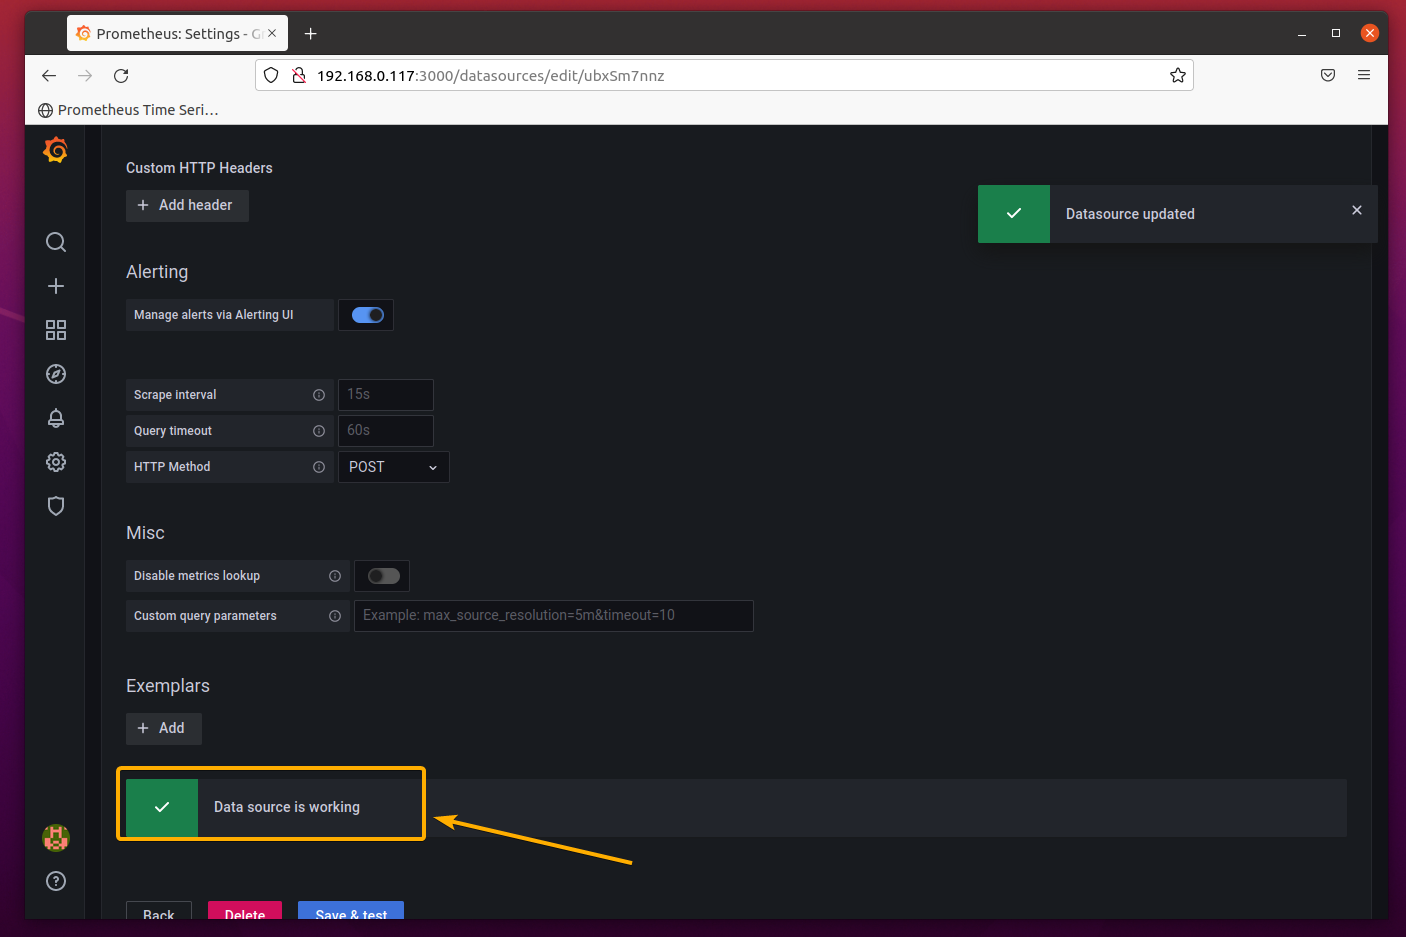
Once you’re done, scroll down a little bit and click on Save & test.
You should see the message Data source is working. It means that Grafana can access Prometheus.
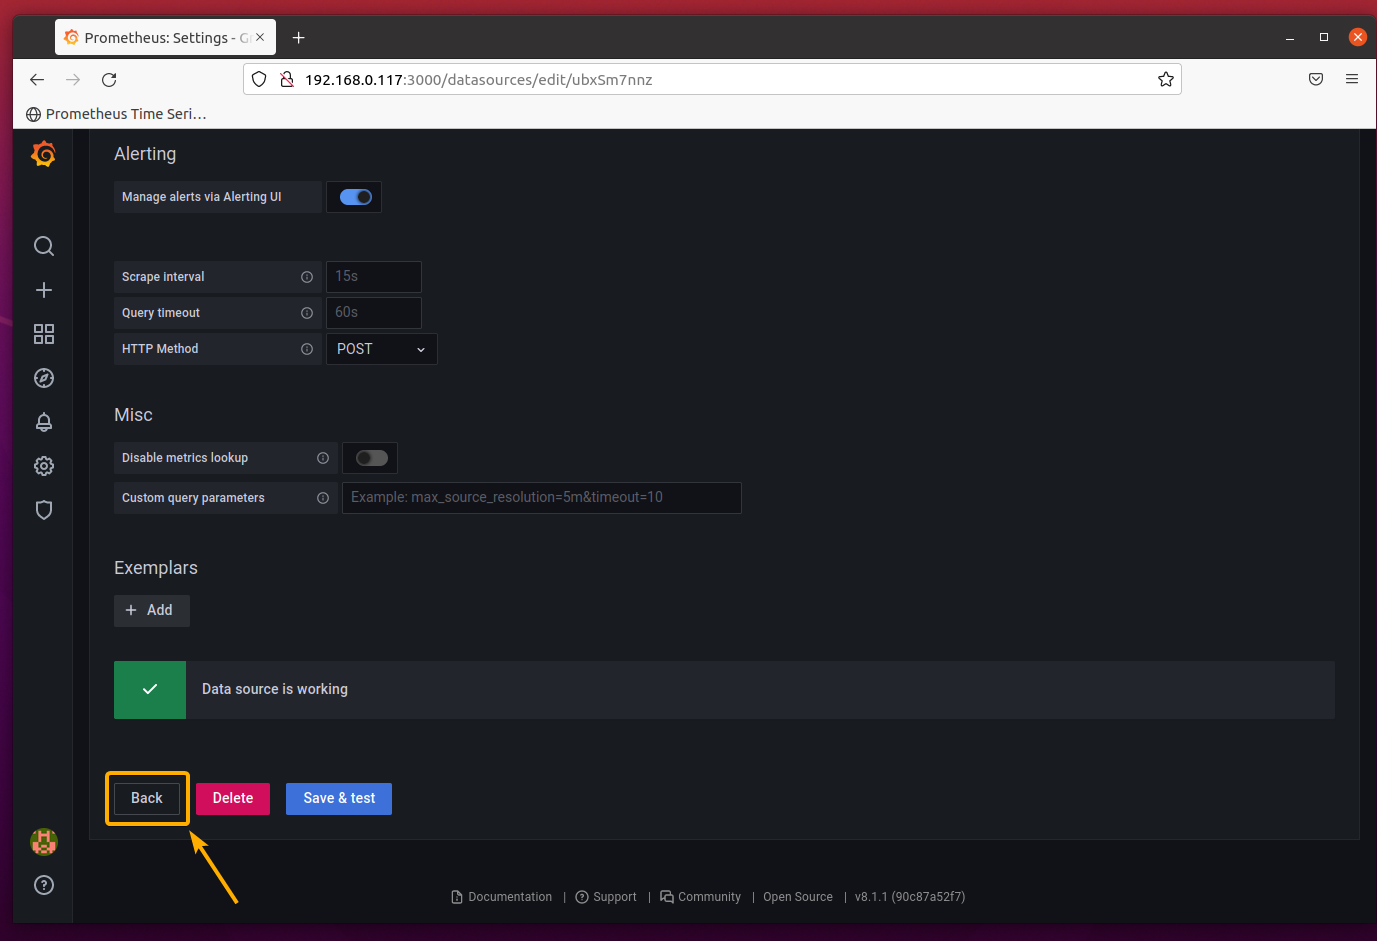
Click on Back.
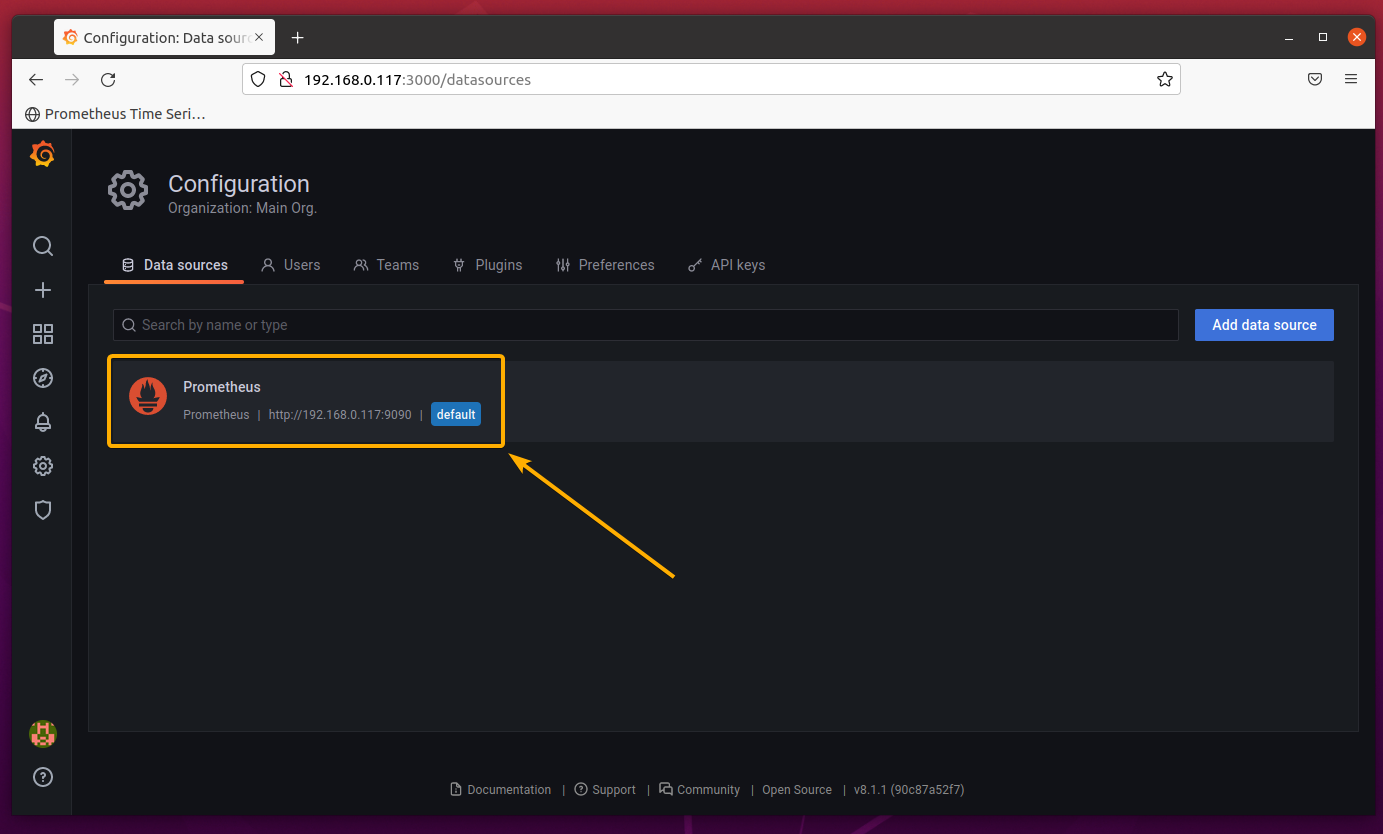
Prometheus should be added as a Grafana data source, as you can see in the screenshot below.
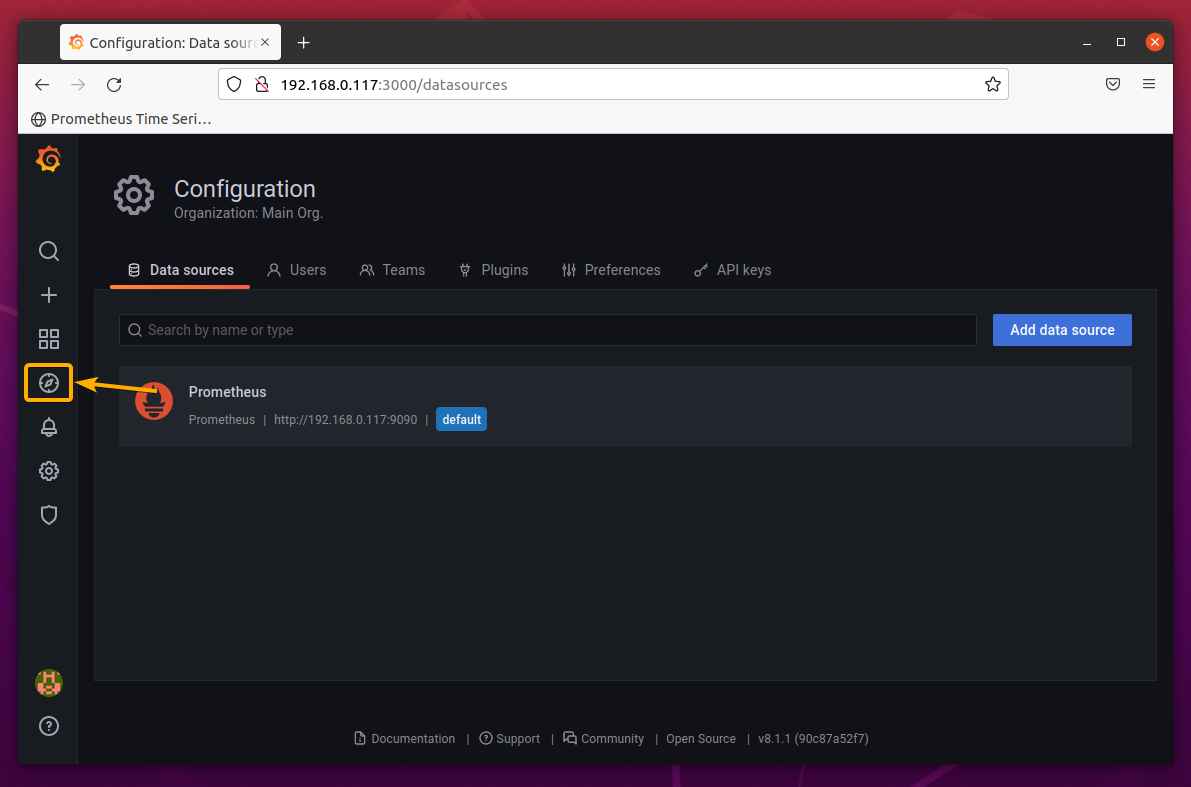
Click on the Explore () as marked in the screenshot below.
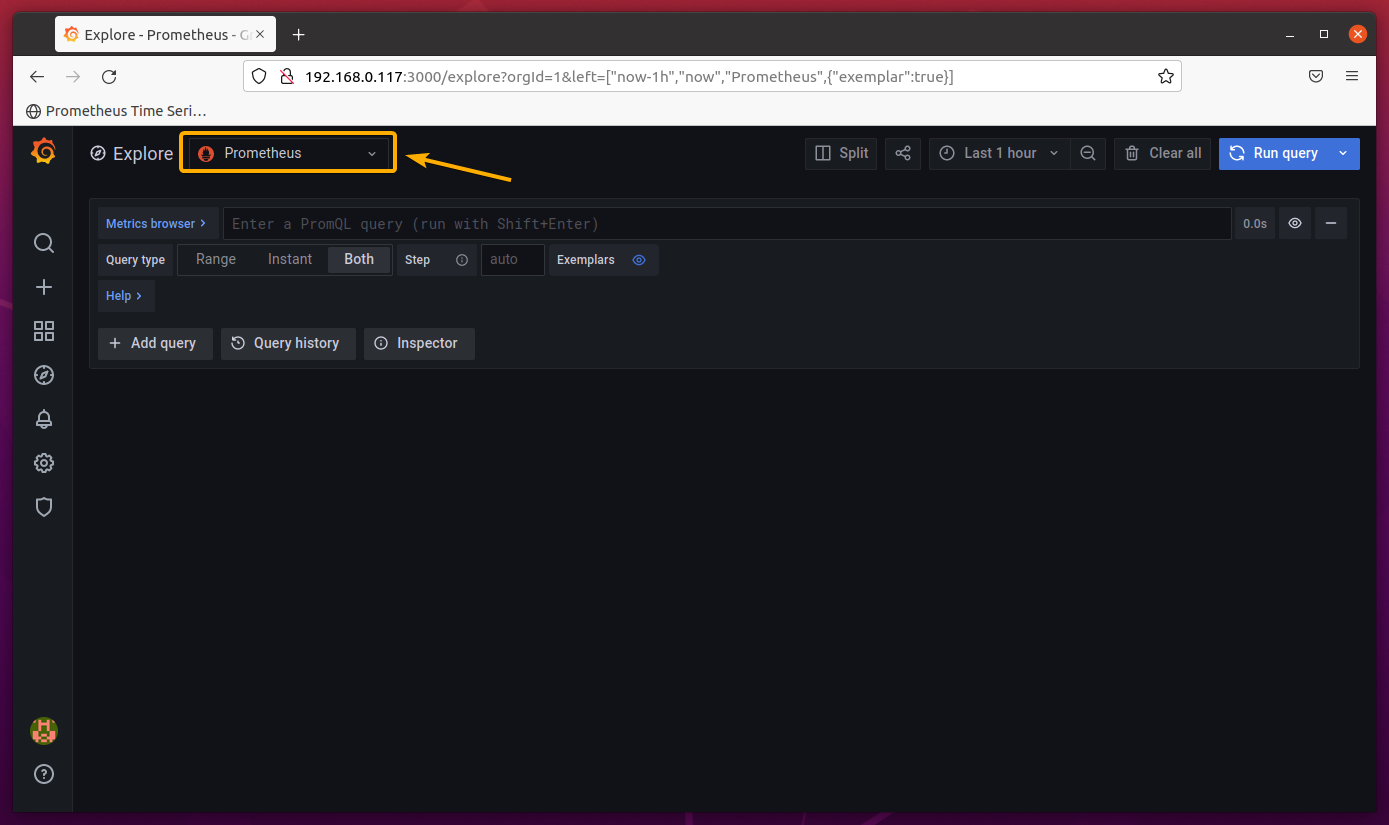
Select Prometheus as the Explore source.
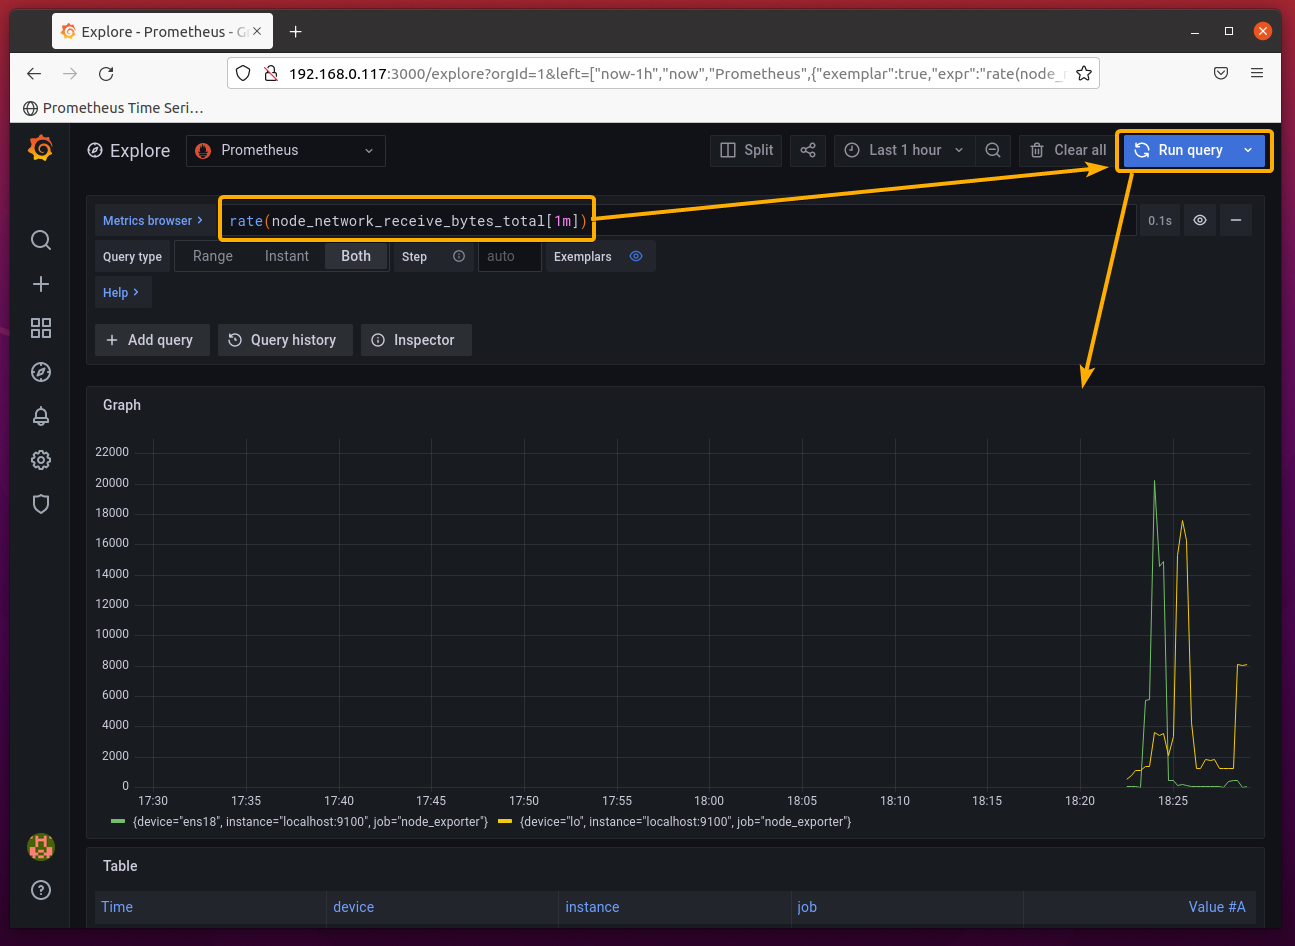
Now, you should run the Prometheus Graph expression from here, as you can see in the screenshot below.
This interface is almost the same as the Prometheus Graph page. But it has more features.
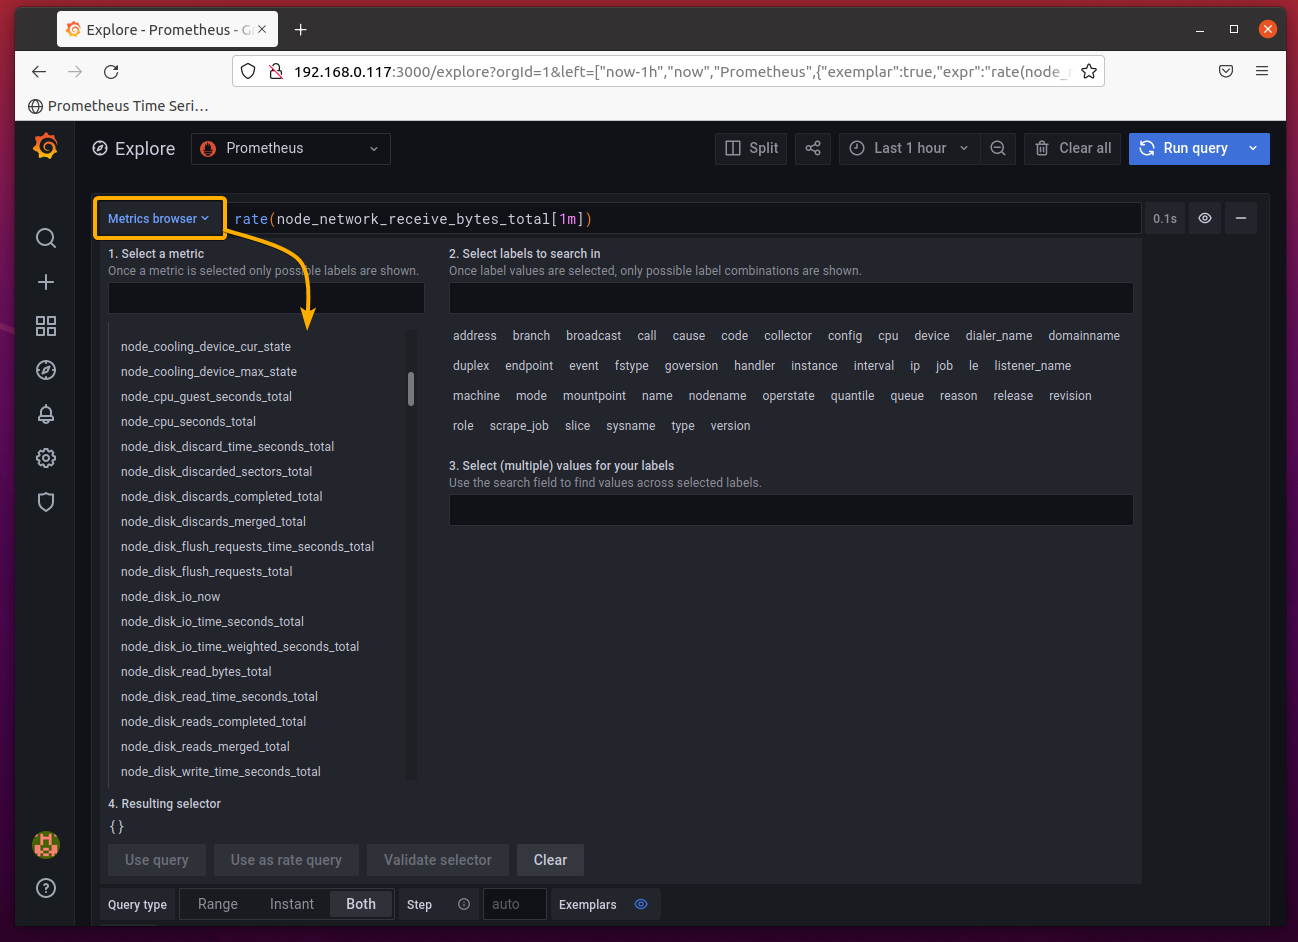
You can click on the Metrics browser dropdown menu to find all the exported Prometheus metrics that you can use from Grafana, as you can see in the screenshot below.
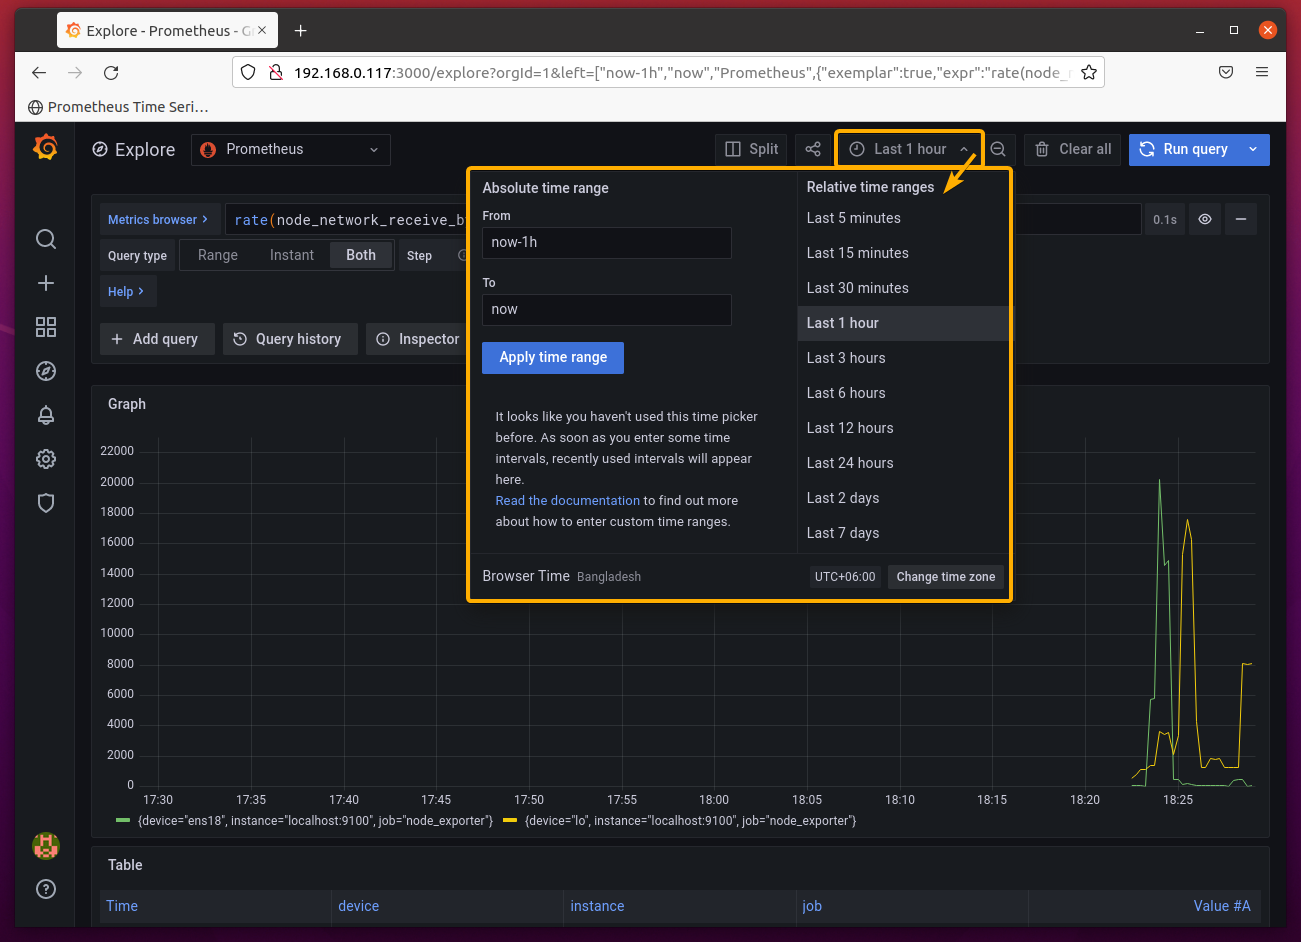
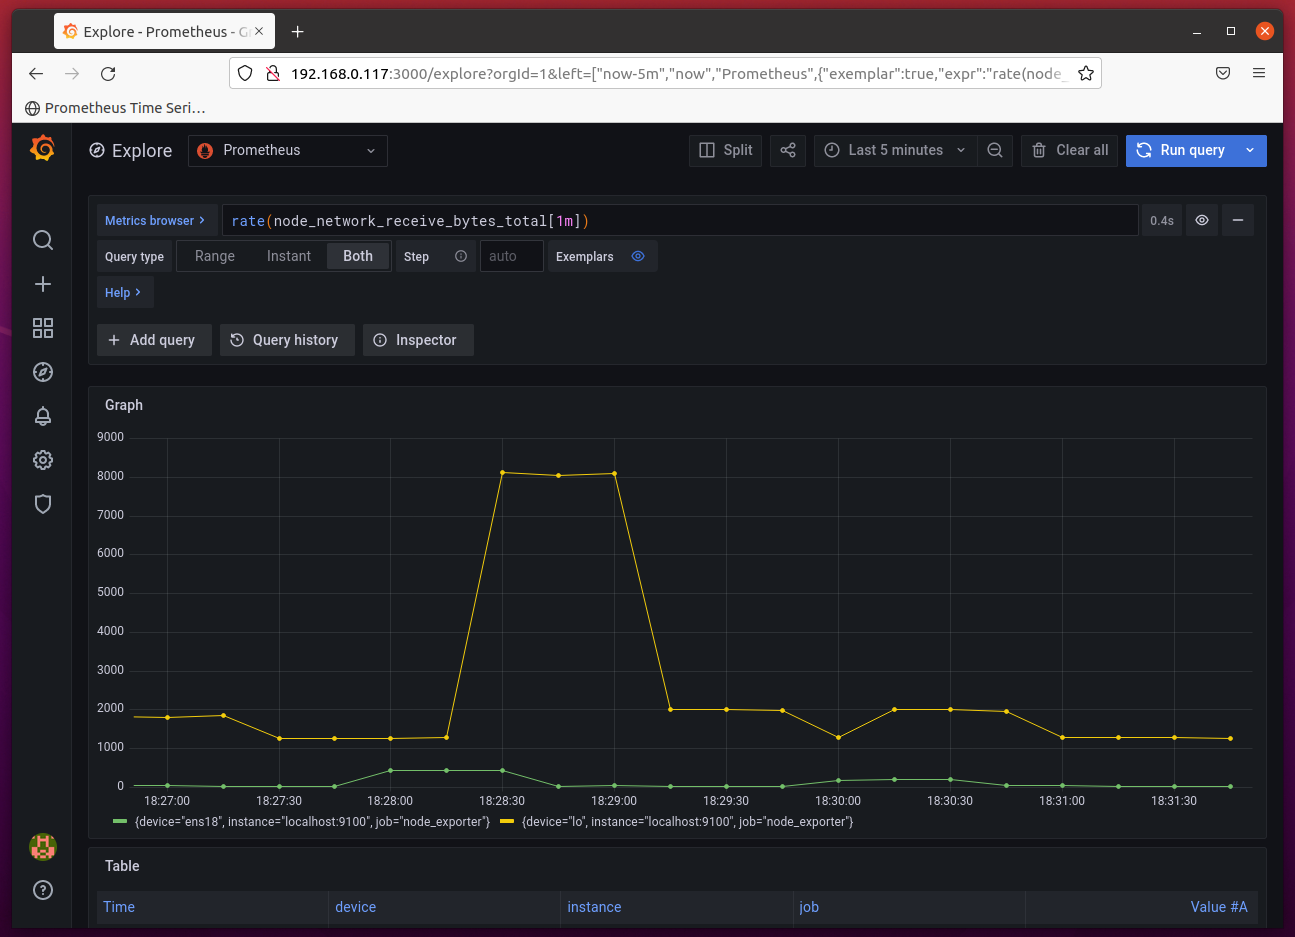
You can change the graph timeline from the Grafana Explore page as well.
As you can see, I have set the graph timeline to Last 5 minutes, and the graph looks really good in Grafana.
Creating a Dashboard for Network Monitoring:
In this section, I will show you how to create your own Grafana network monitoring dashboard using the Prometheus data source. This should help you get started with some of the most common features of the Grafana dashboard.
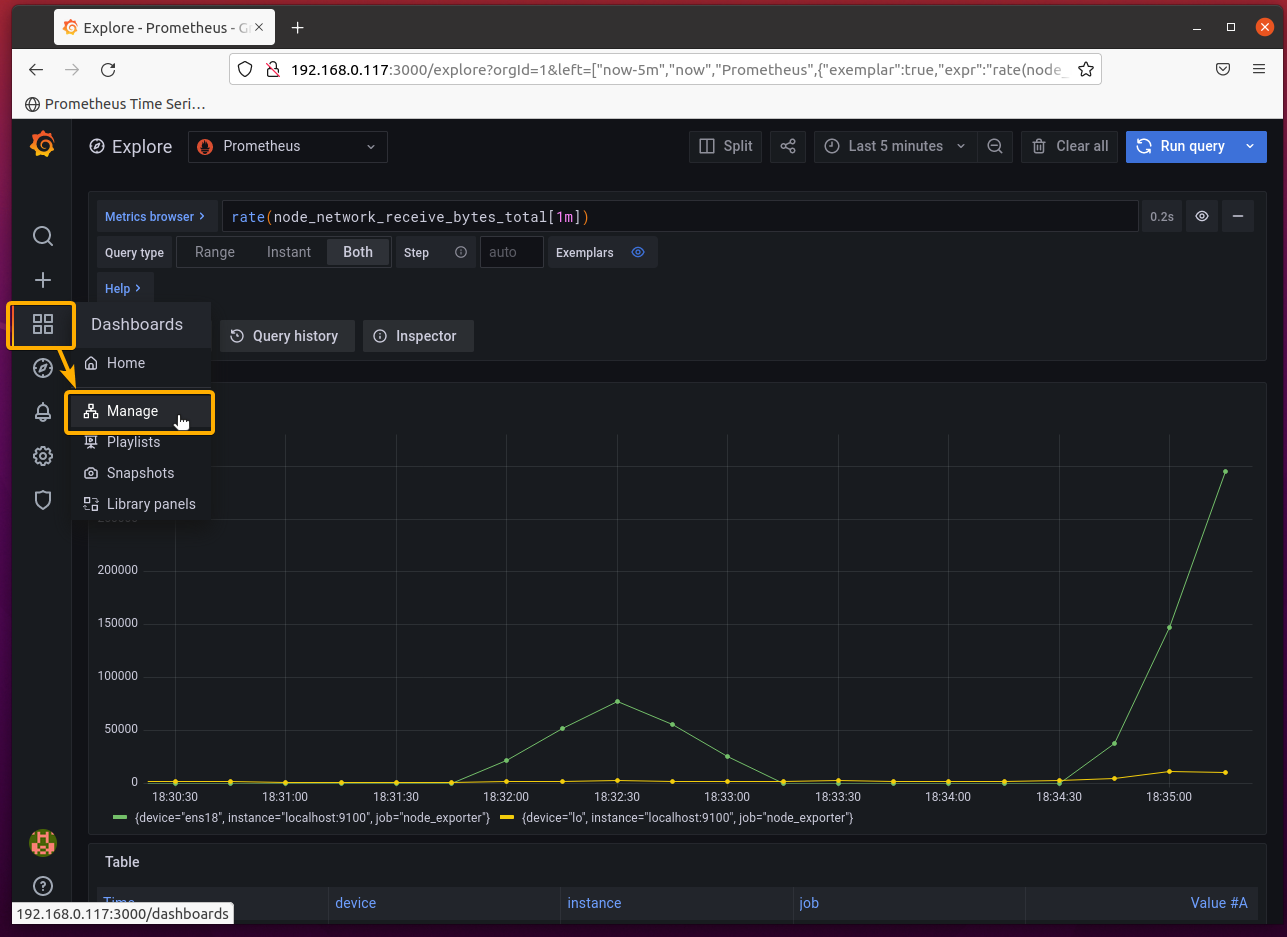
To create a new Grafana dashboard, click on Dashboards () > Manage as marked in the screenshot below.
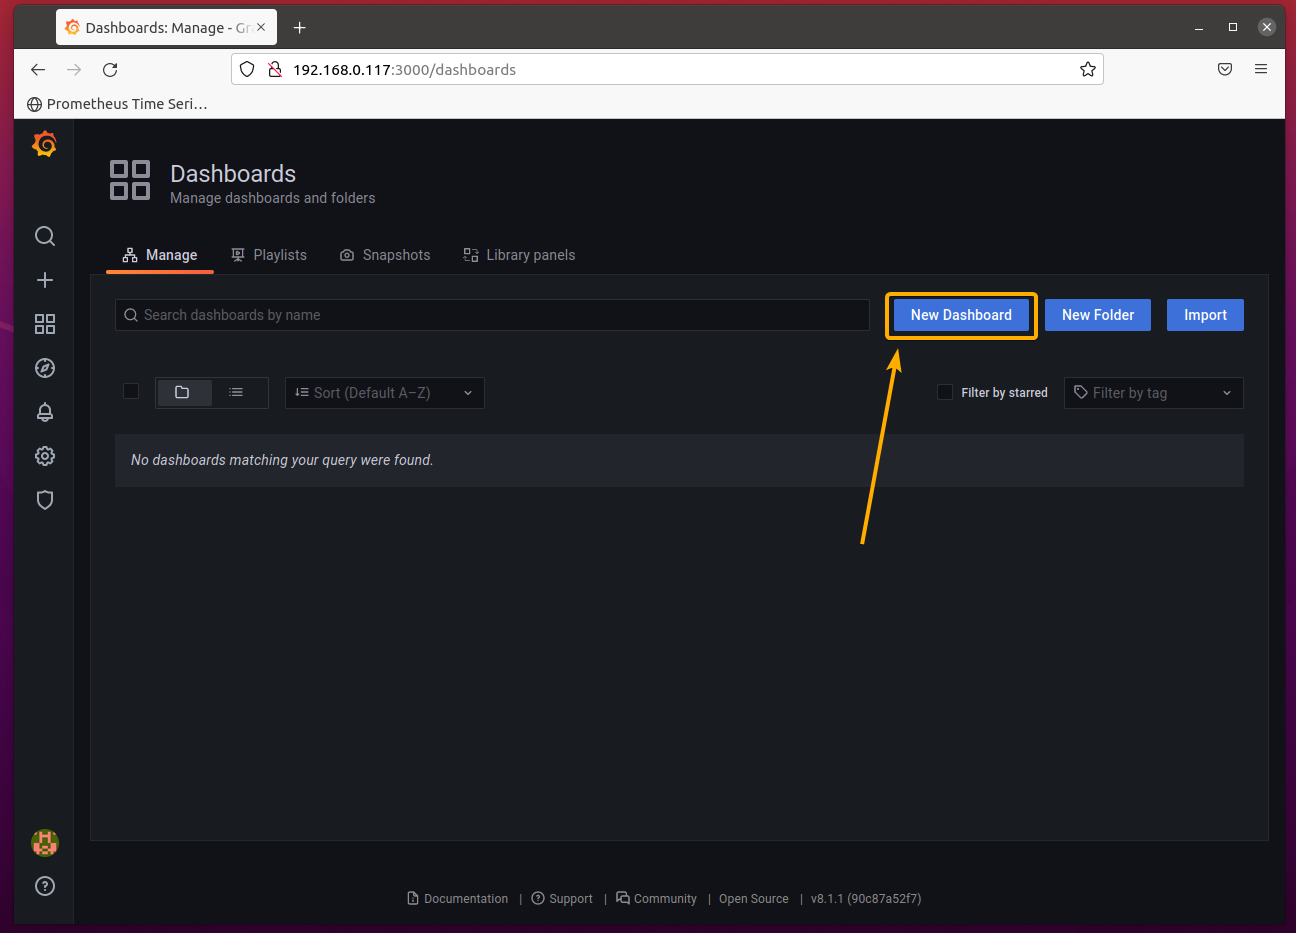
Click on New Dashboard.
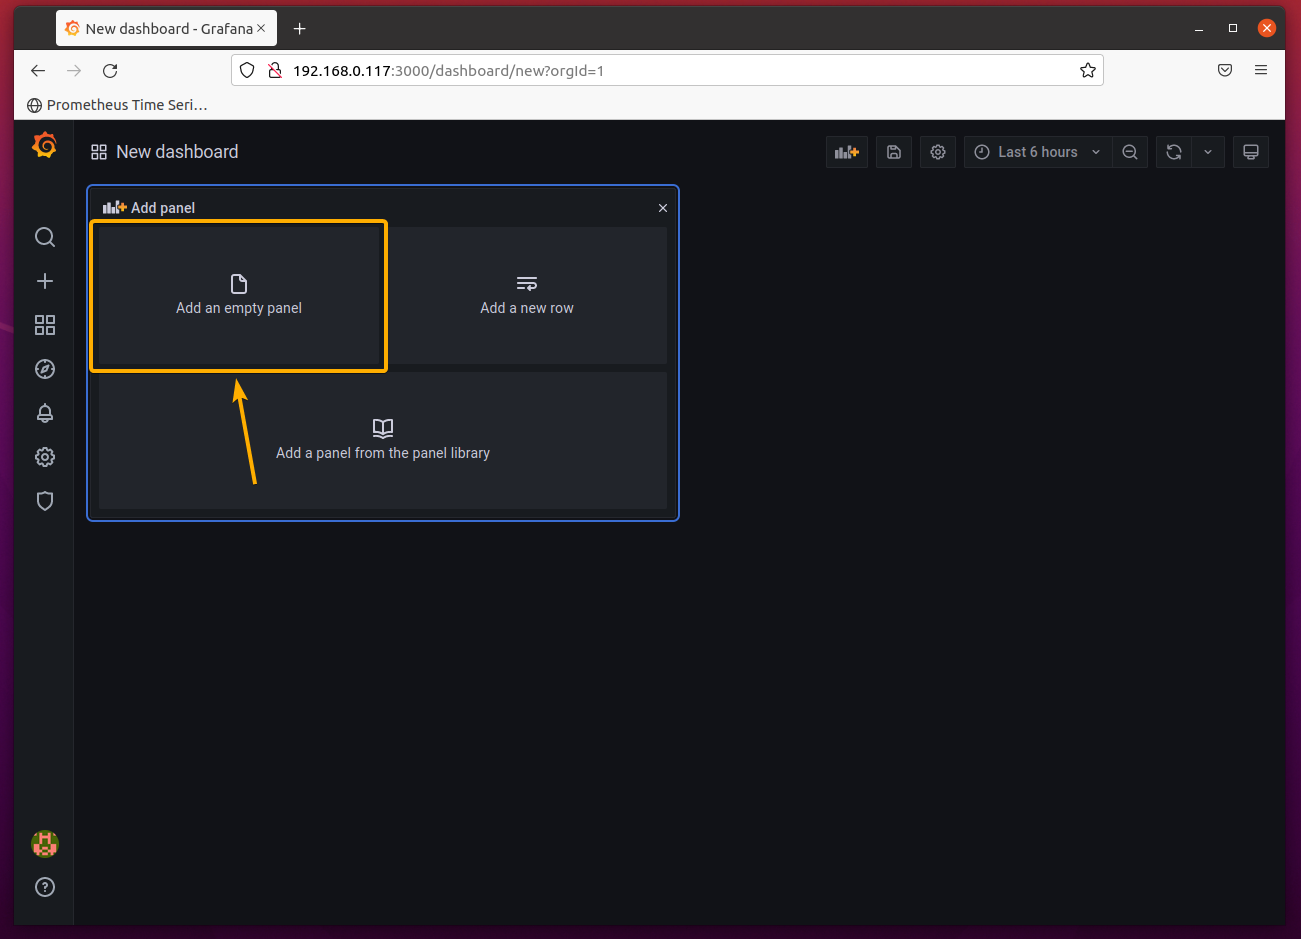
Click on Add an empty panel as marked in the screenshot below.
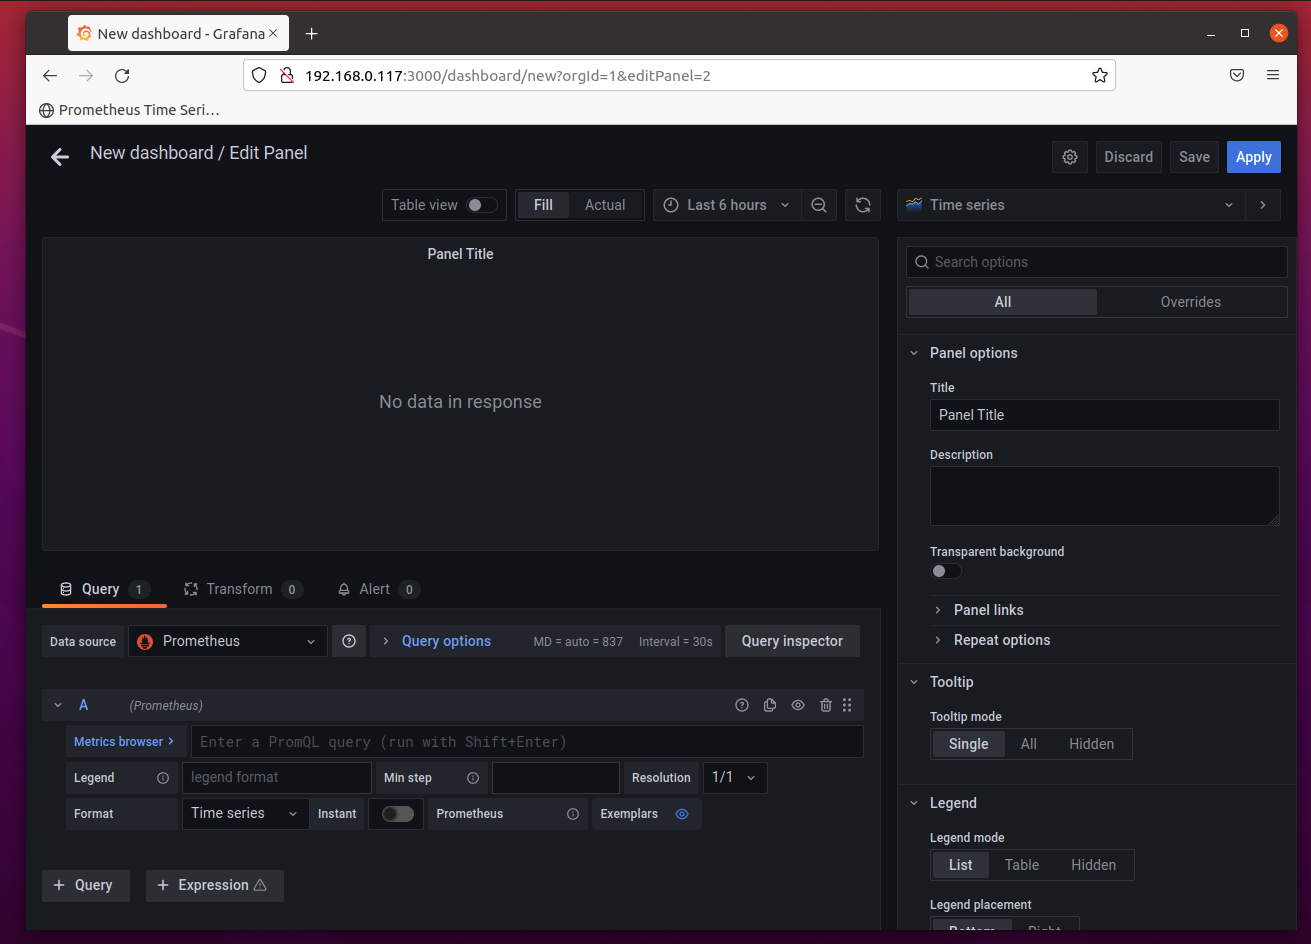
The Grafana panel editor should be displayed. You can create a Grafana Dashboard panel from here.
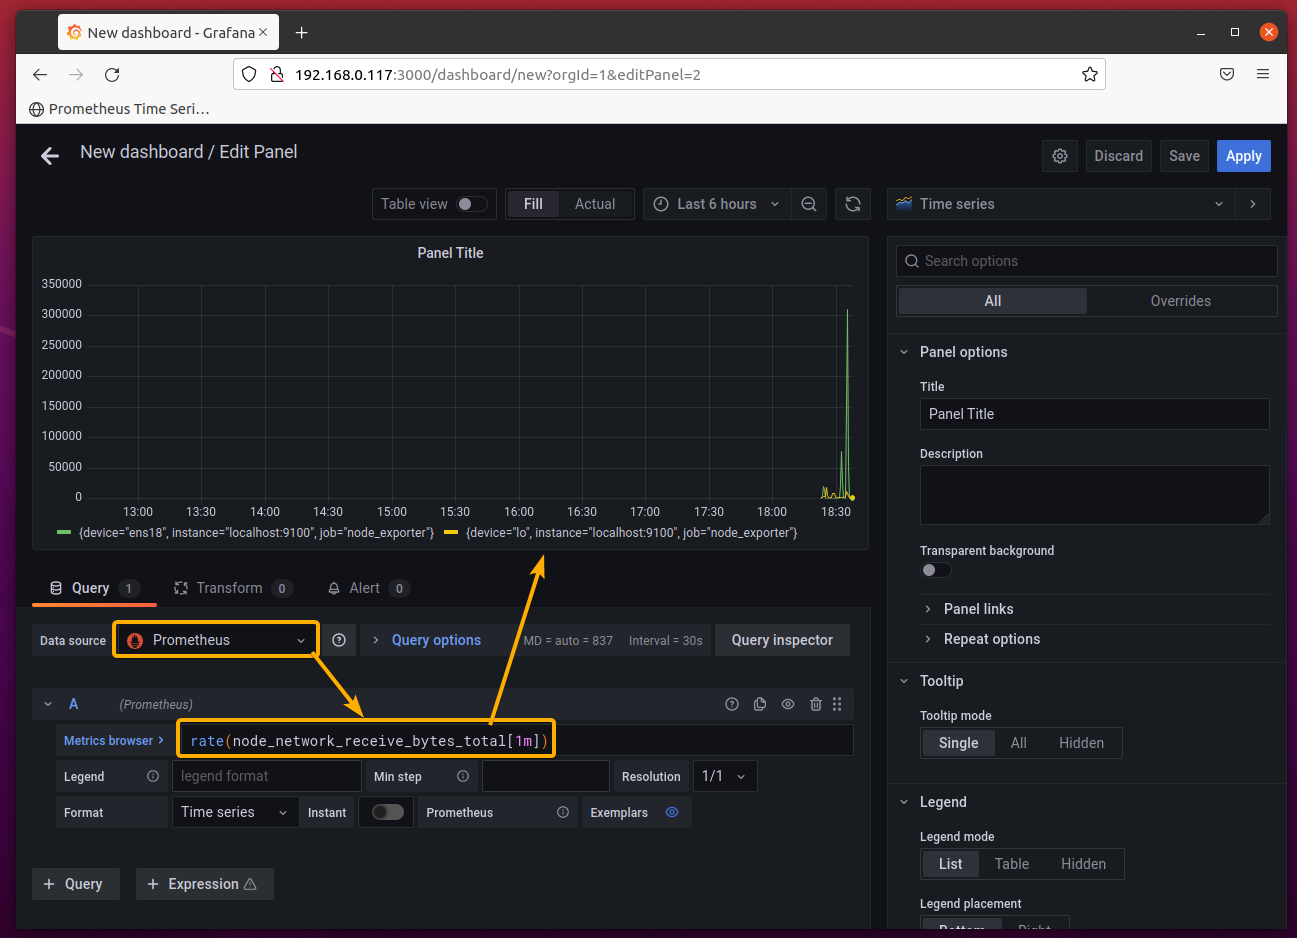
Select Prometheus as the Data source and type in rate(node_network_receive_bytes_total[1m]) in the Metrics browser section as marked in the screenshot below.
A graph of the download rate of all the network interfaces (ens18 and lo in this case) of the computer where Node Exporter is installed should be displayed.
NOTE: I have installed Node Exporter and Prometheus on the same computer. To learn more about how I have set it up, check out How to Install Prometheus on Ubuntu 20.04 LTS.
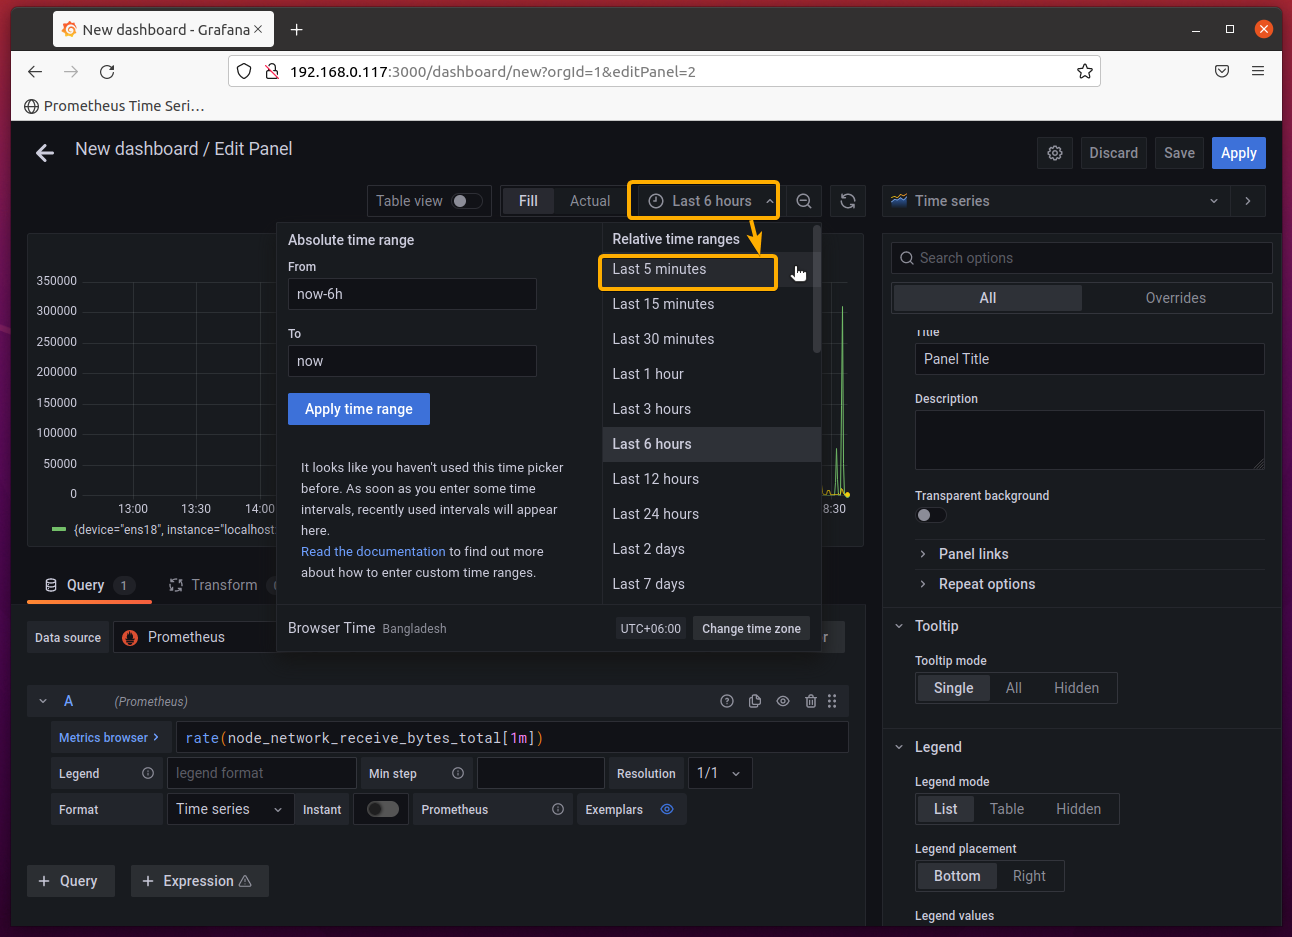
By default, the Graph timeline is set to 6 hours. Please set it to the Last 5 minutes as marked in the screenshot below.
This way, you can observe the download speed of the network interfaces for the last 5 minutes.
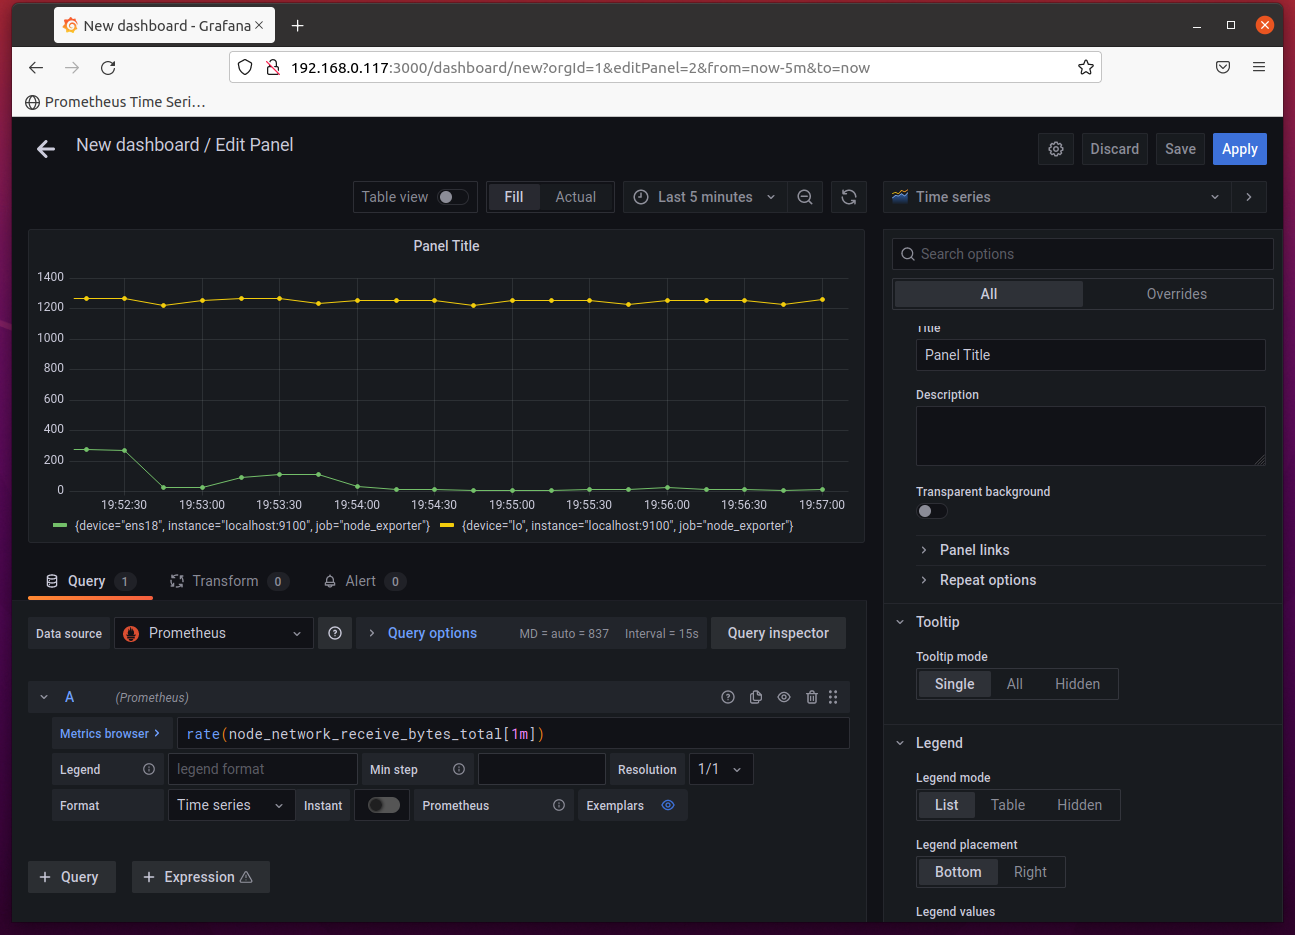
This is how the panel should look like after setting the Graph timeline to Last 5 minutes.
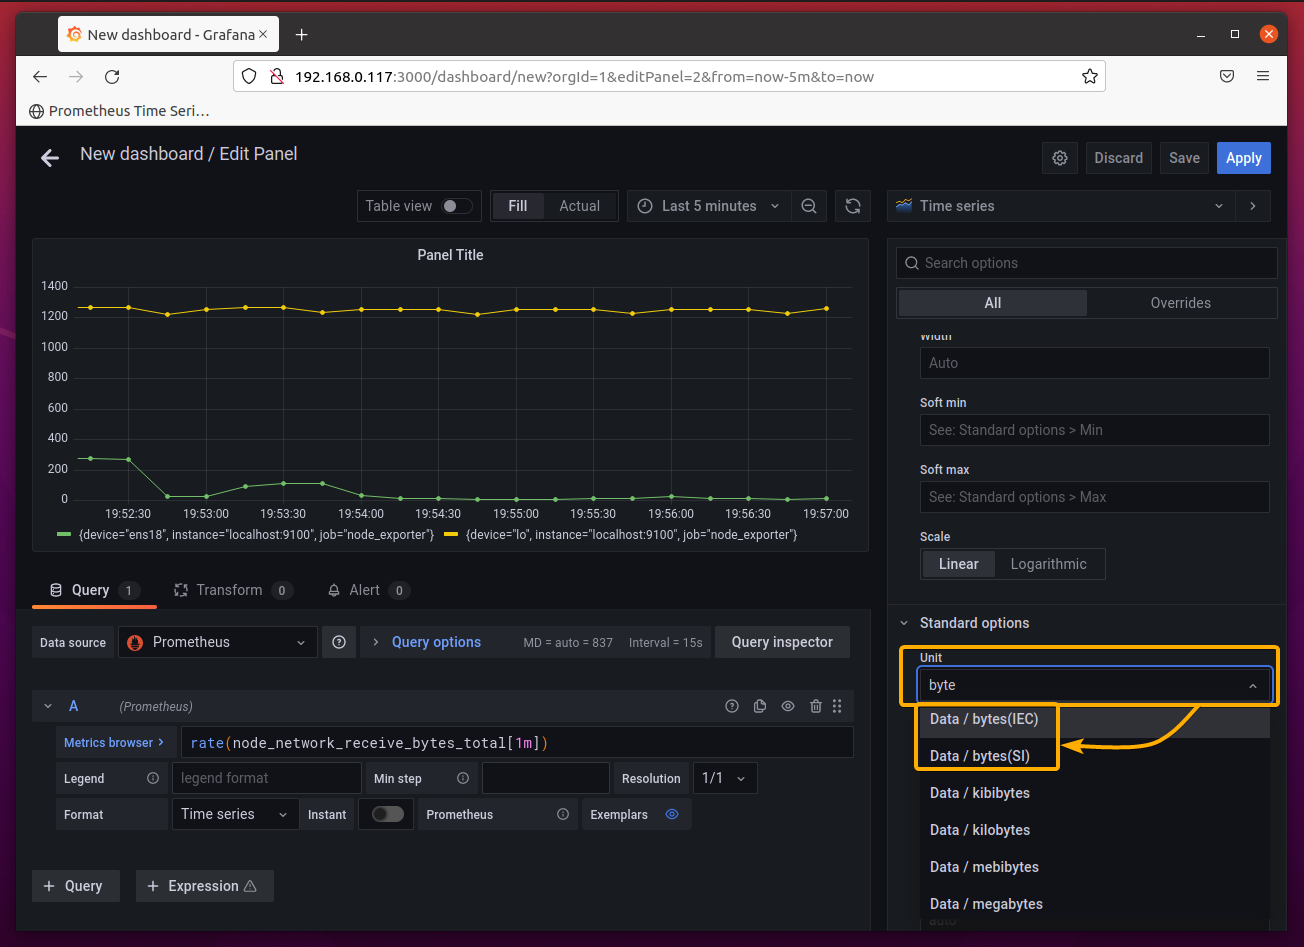
Now, you have to set a unit for the graph. As you’re monitoring network speed, the unit should be in bytes. You can select bytes unit from the Standard Options > Unit as shown in the screenshot below. Just search for bytes and click on one of the marked units.
Data/bytes (IEC) – This will show the unit in powers of 2. So, 1024 bytes would be 1 MiB (mebibytes).
Data/bytes (SI) – This will show the unit in powers of 10. So, 1000 bytes would be 1 MB (megabytes).
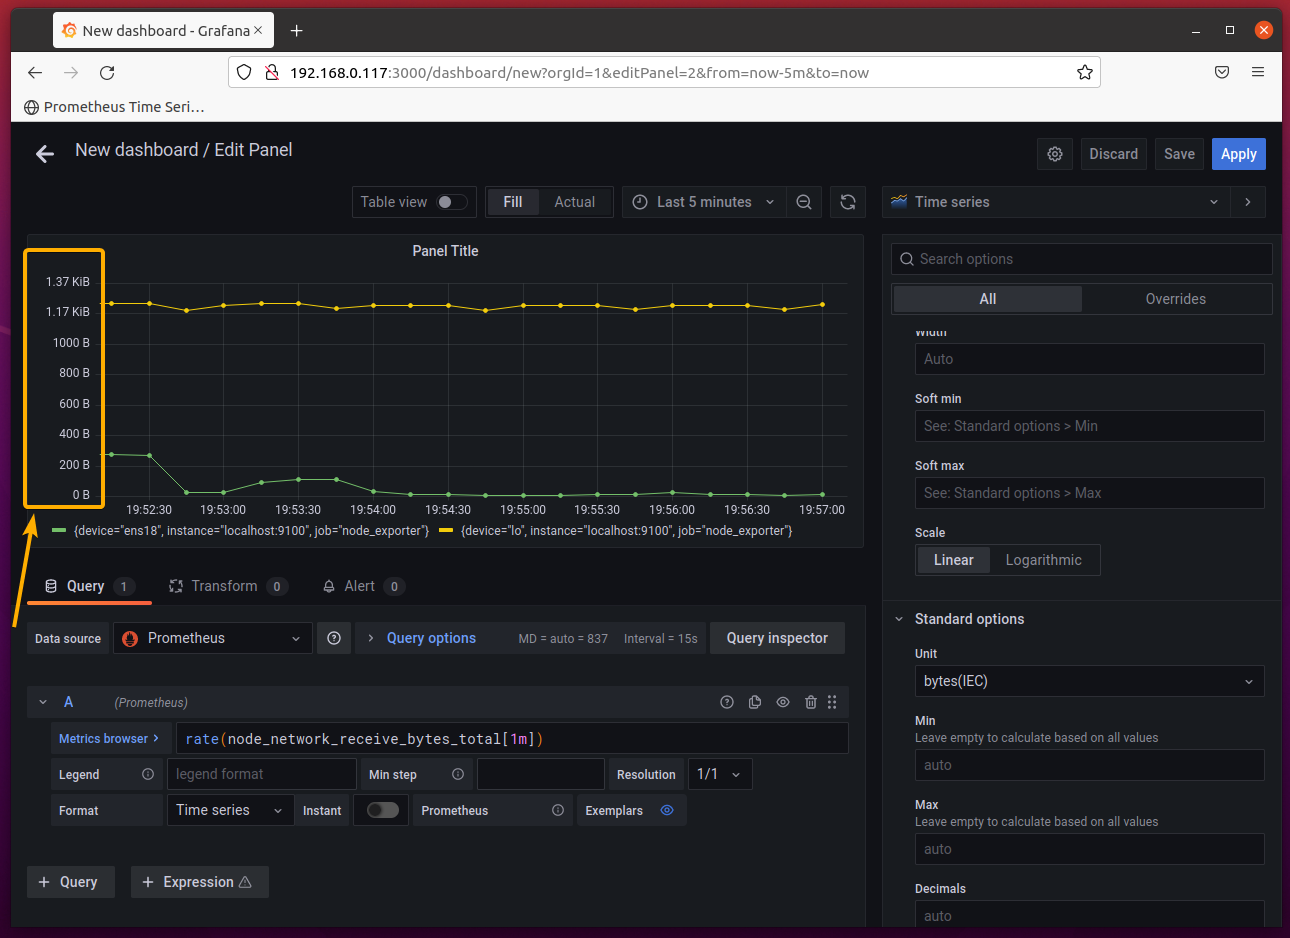
The network speed units should be displayed correctly on the graph, as shown in the screenshot below.
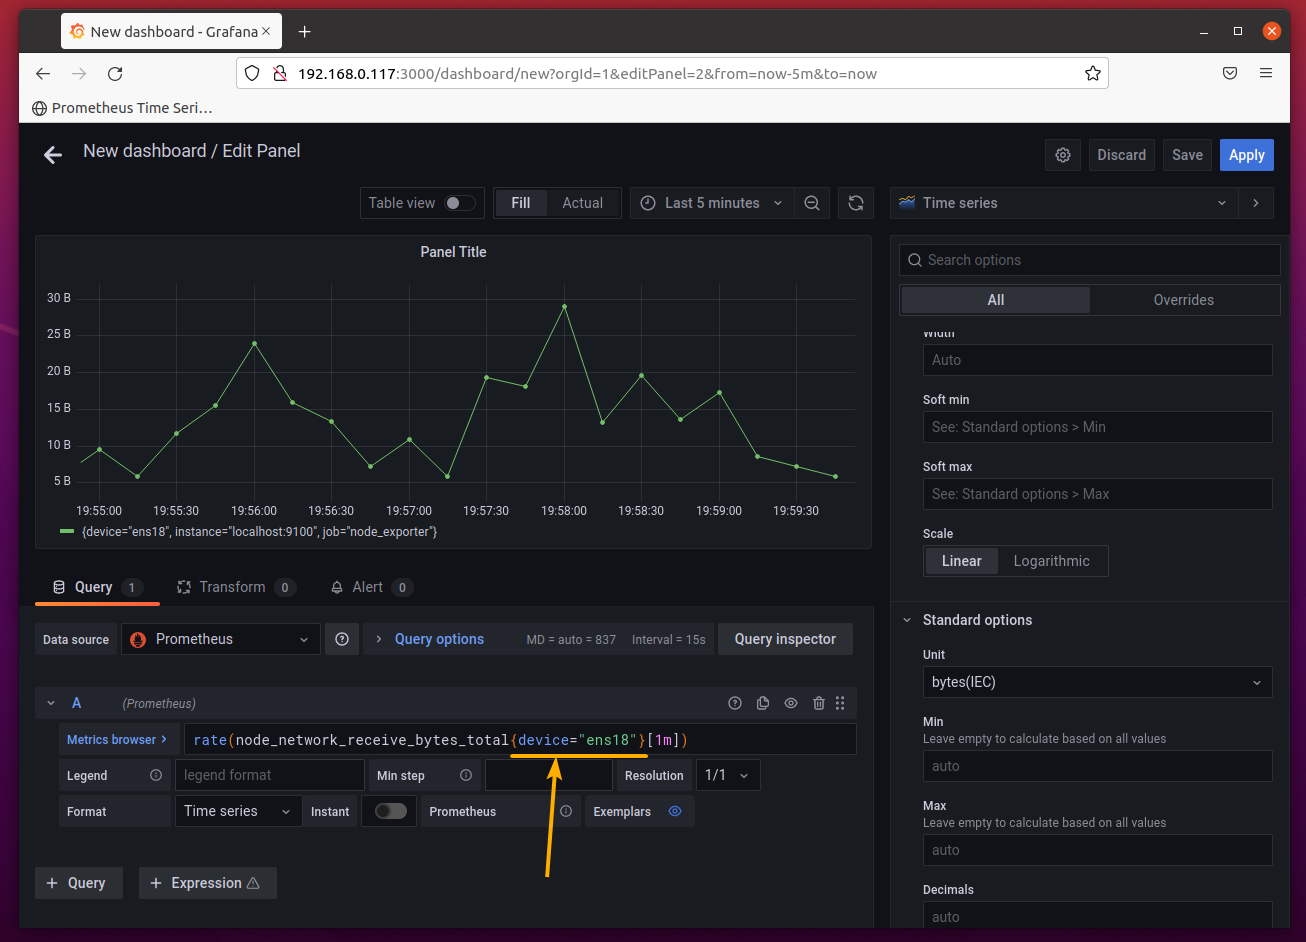
Right now, the ens18 and the loopback device lo are displayed on the graph. But, we don’t really need to monitor the loopback device lo. It’s really easy to fix. All you have to do is select a network interface that you want to monitor.
To select only the ens18 network interface for monitoring, add the {device=”ens18″} filter to the Prometheus expression in the Metrics browser section as marked in the screenshot below. The ens18 network interface should be selected for monitoring only.
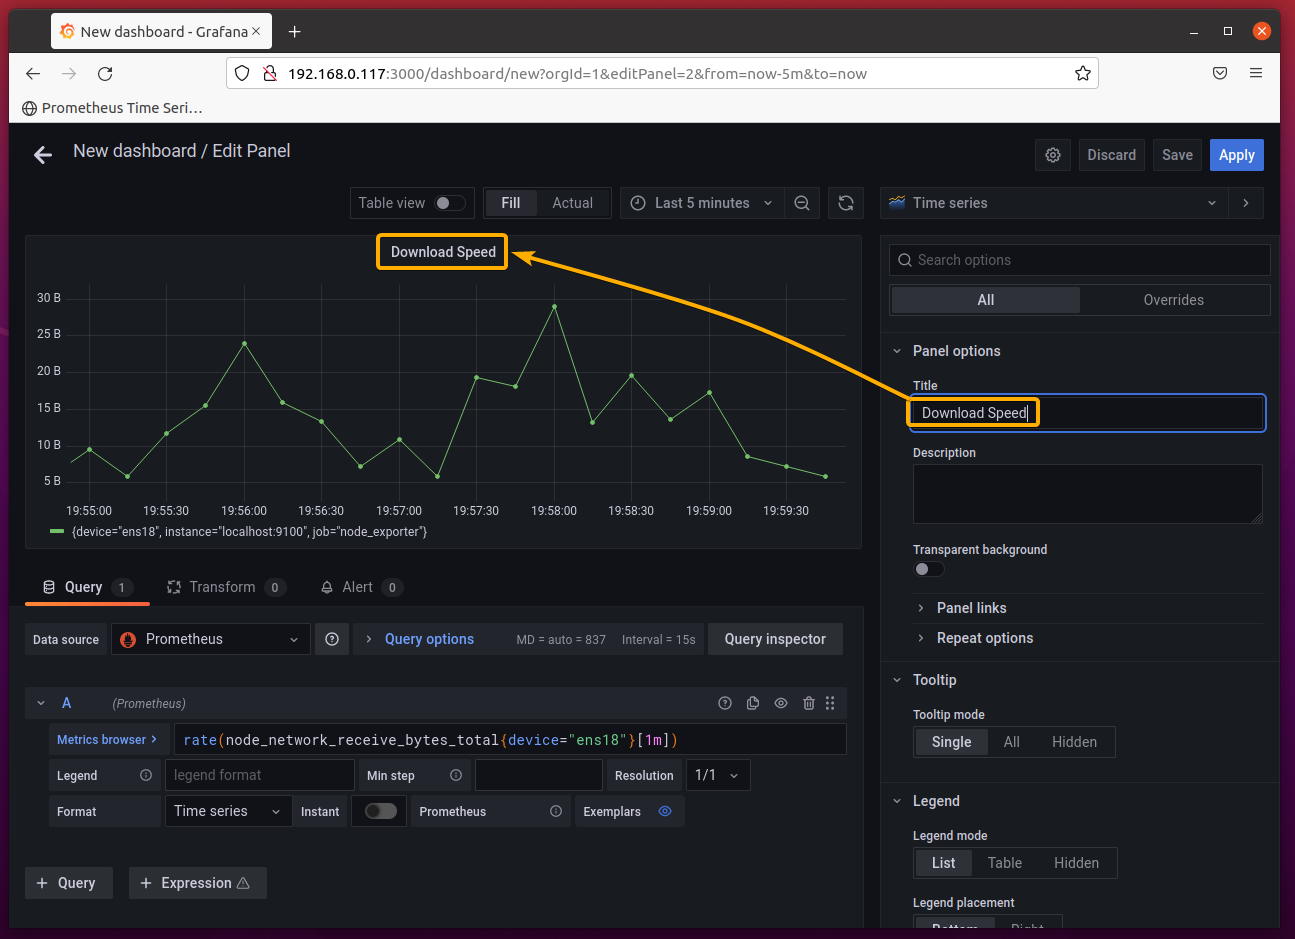
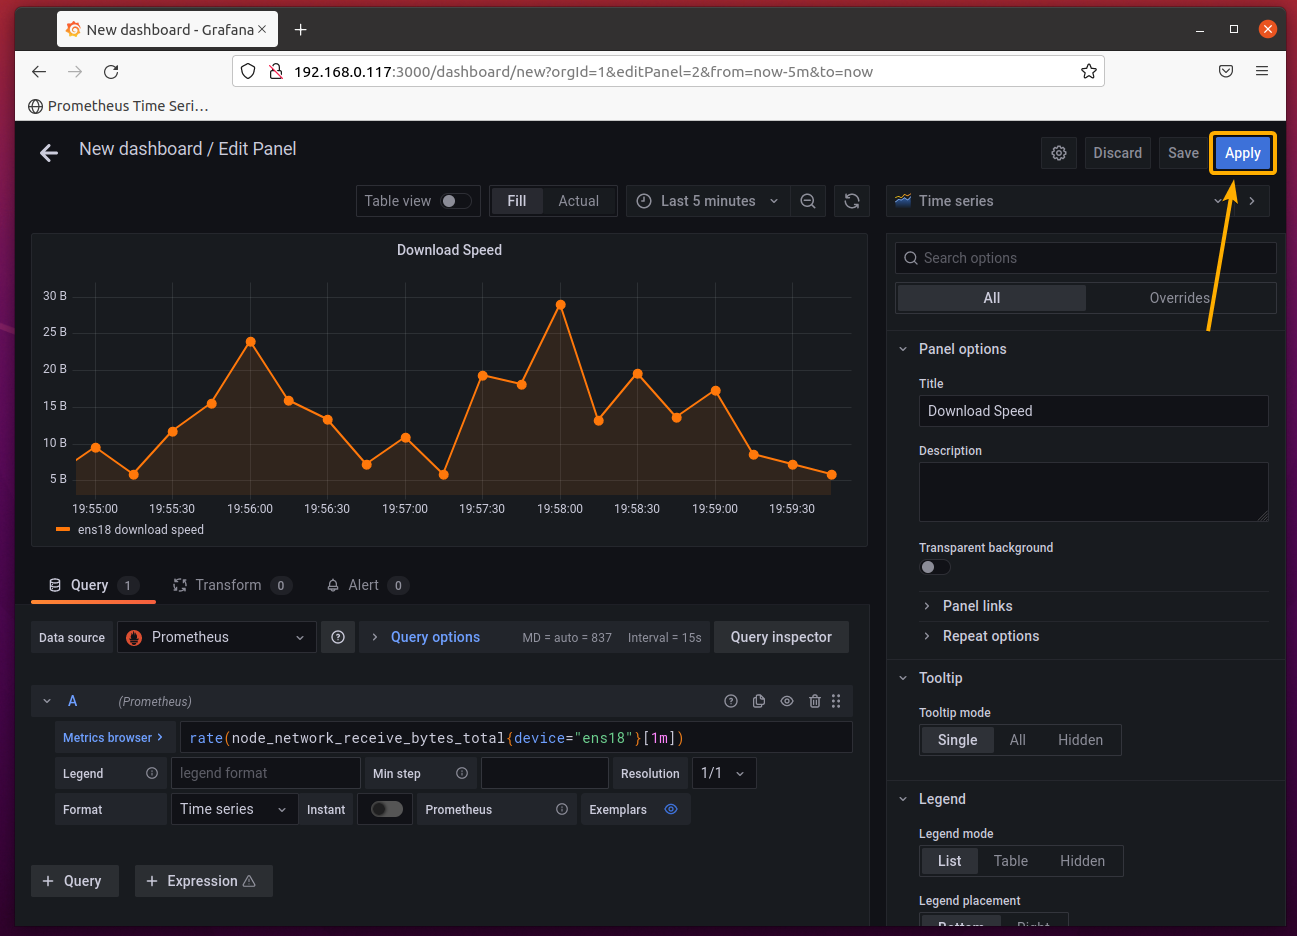
From the Panel options section, set a title for the panel. I have set it to Download Speed.
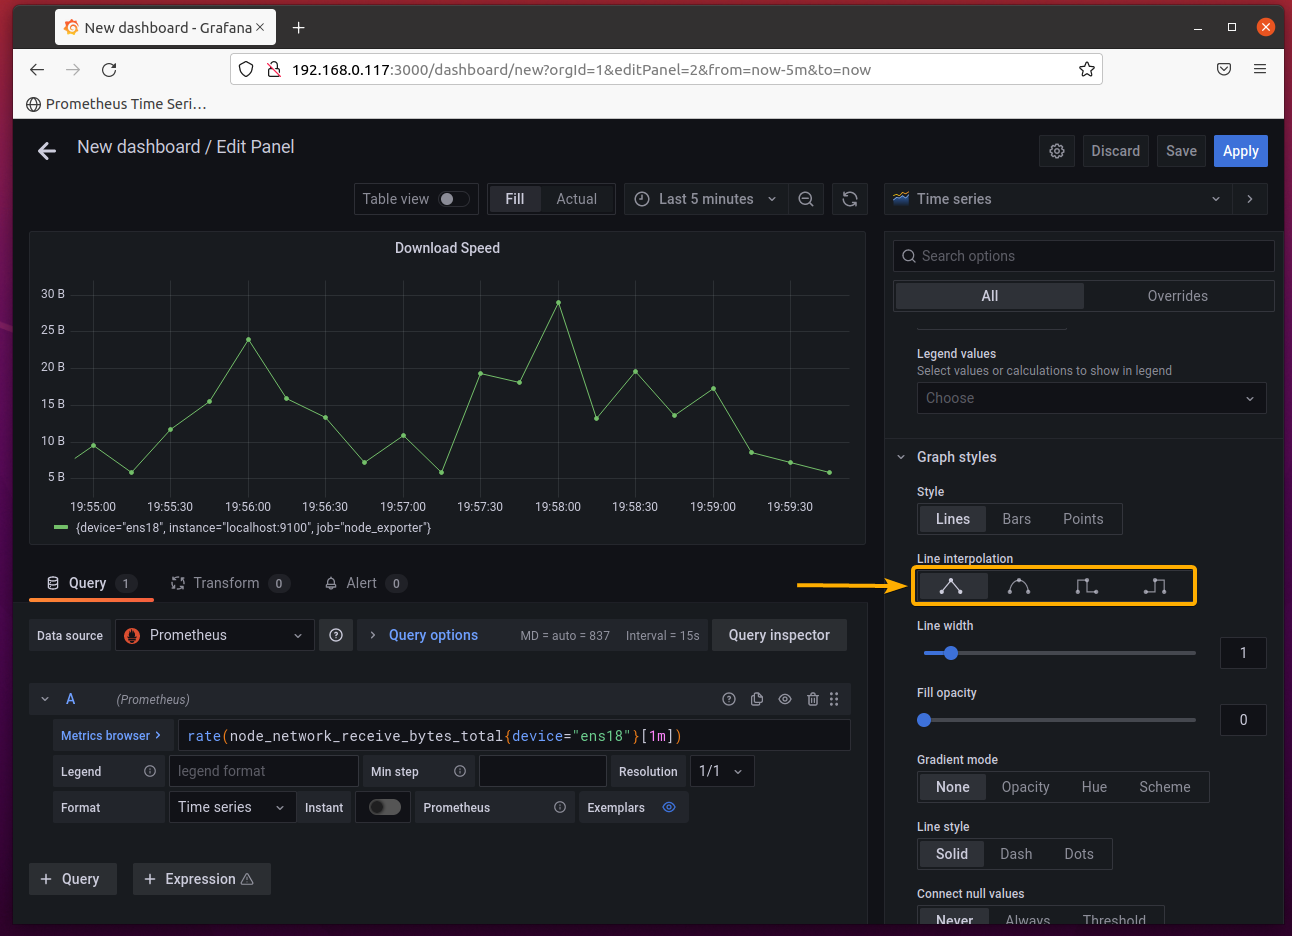
From the Graph styles section, you can select a different Line interpolation method to make the graph easier to understand or make it prettier.
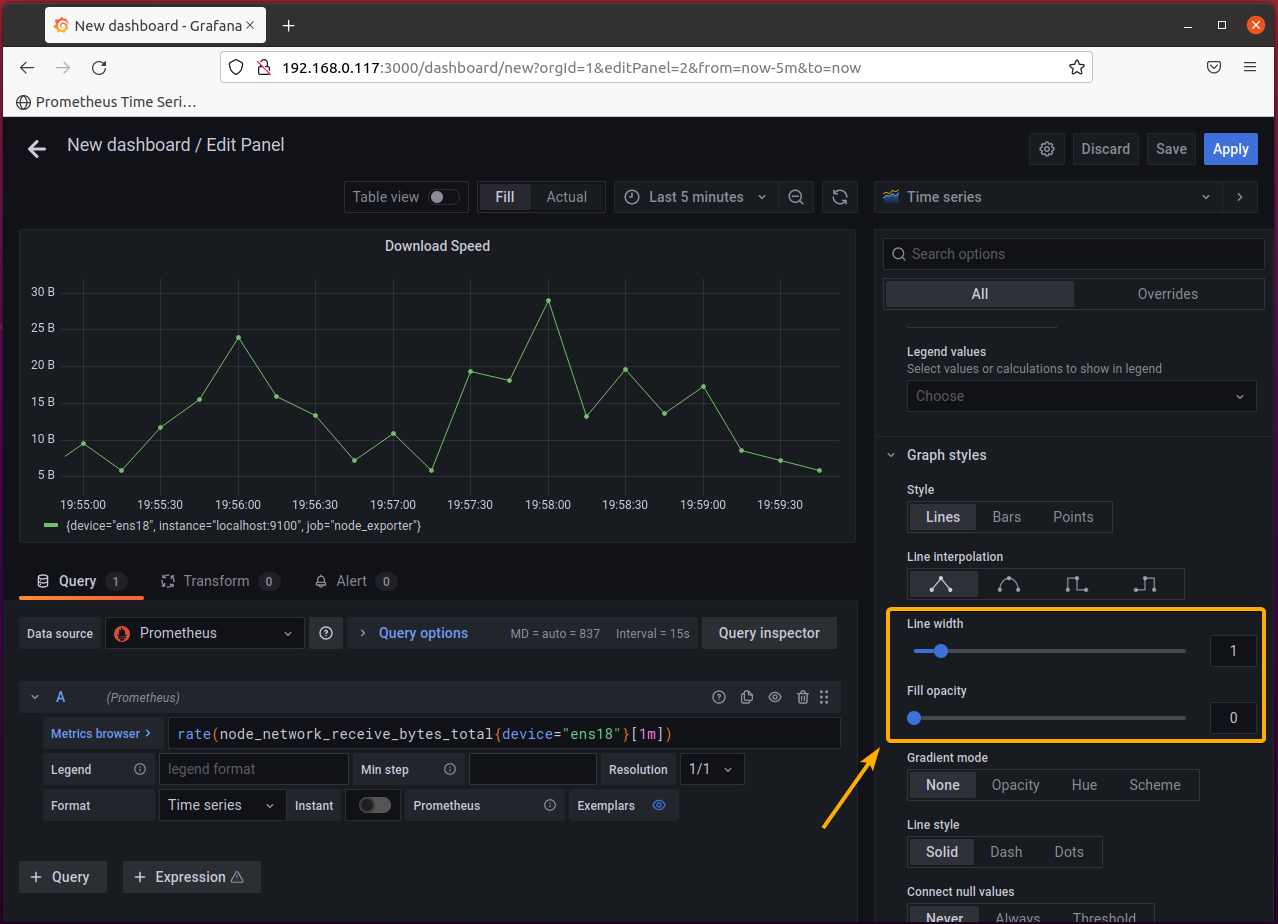
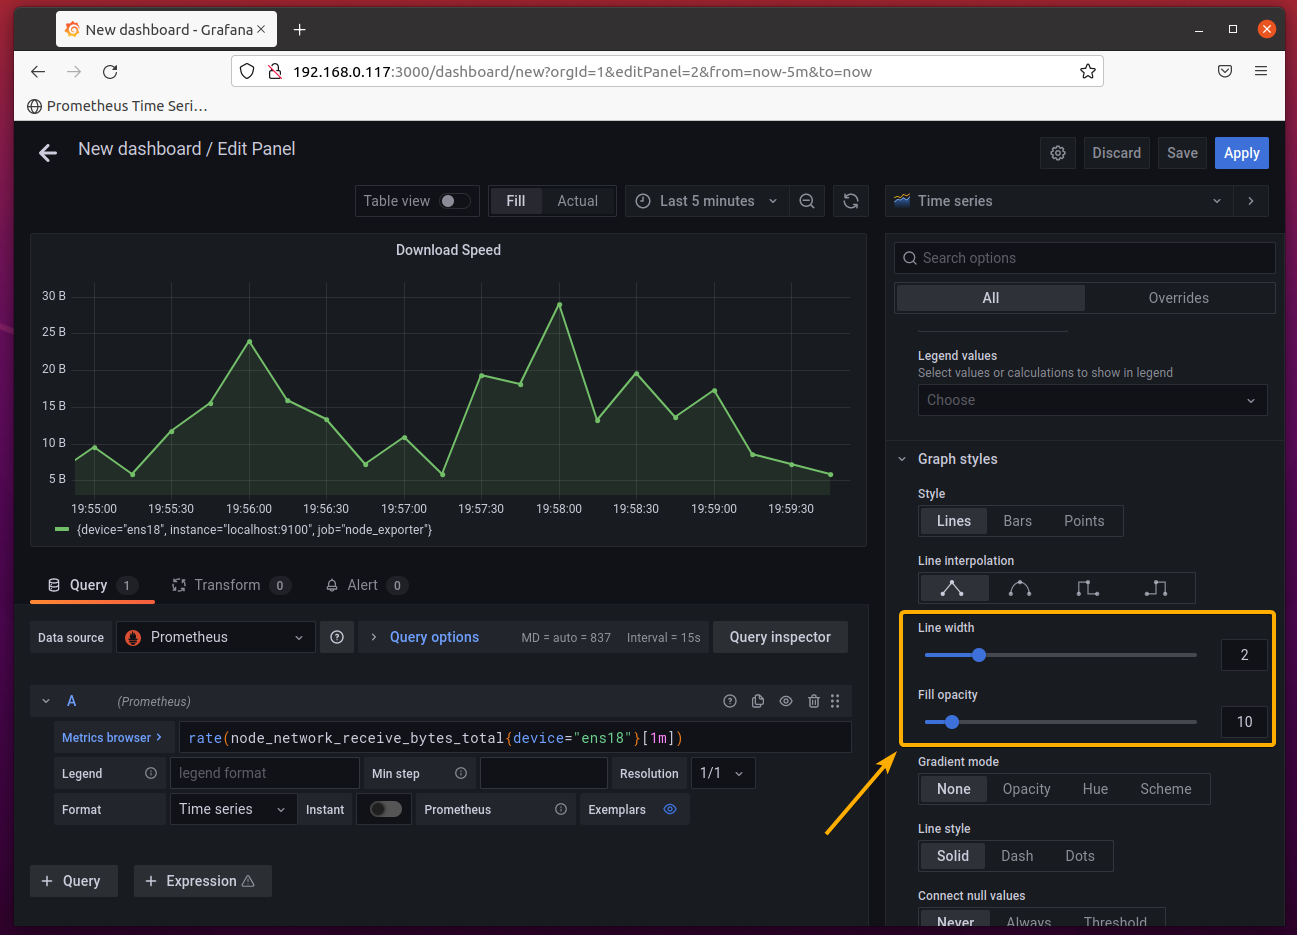
From the Graph styles section, you can also set the Line width and Fill opacity for the graph to make it prettier.
As you can see, I have set the Line width to 2 and set the Fill opacity to 10, and the graph looks much nicer than before.
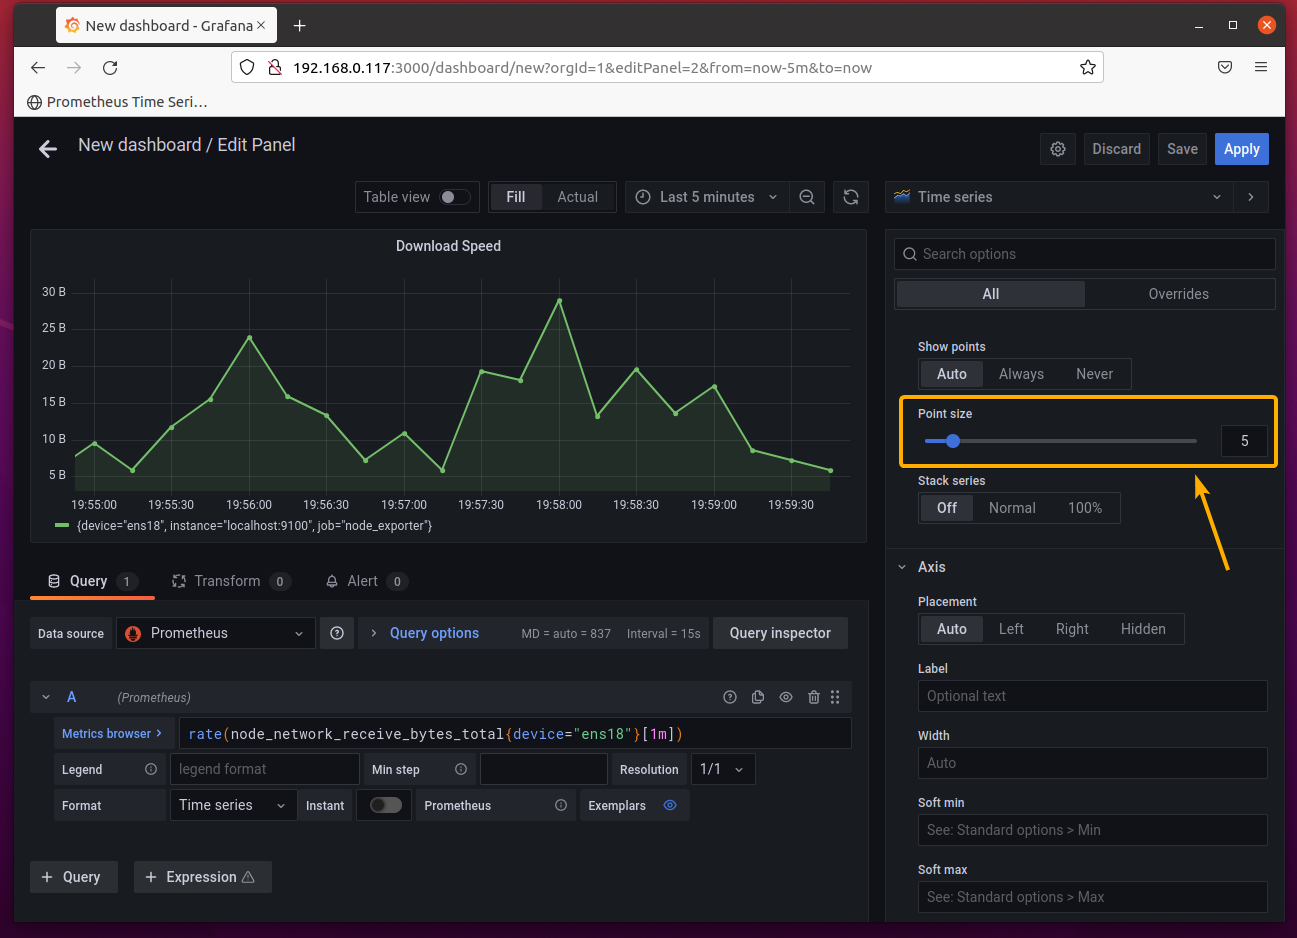
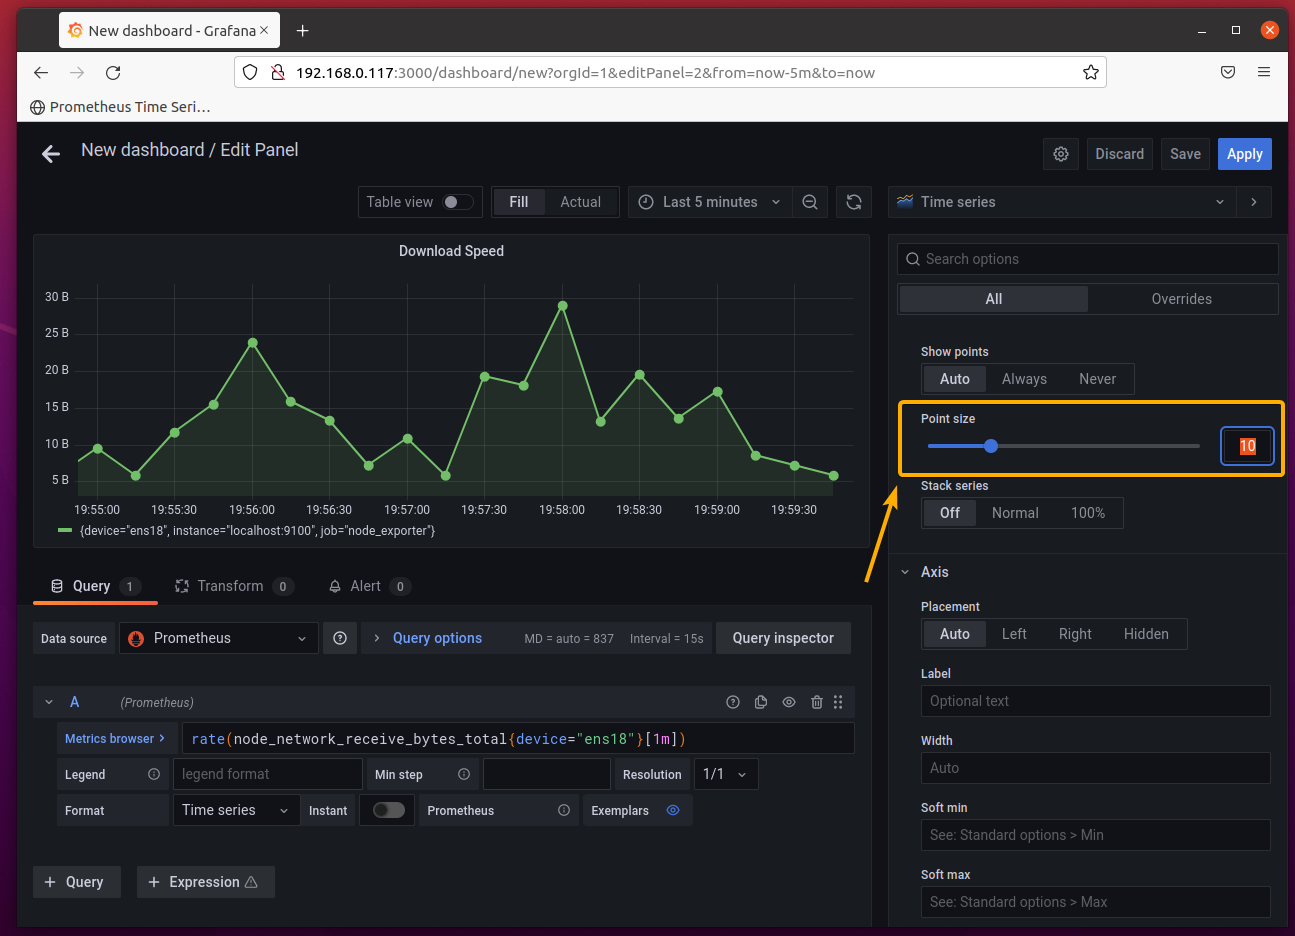
You can also increase the Point size of the graph.
As you can see, setting the Point size to 10 makes the graph’s data points more visible. The graph also looks prettier.
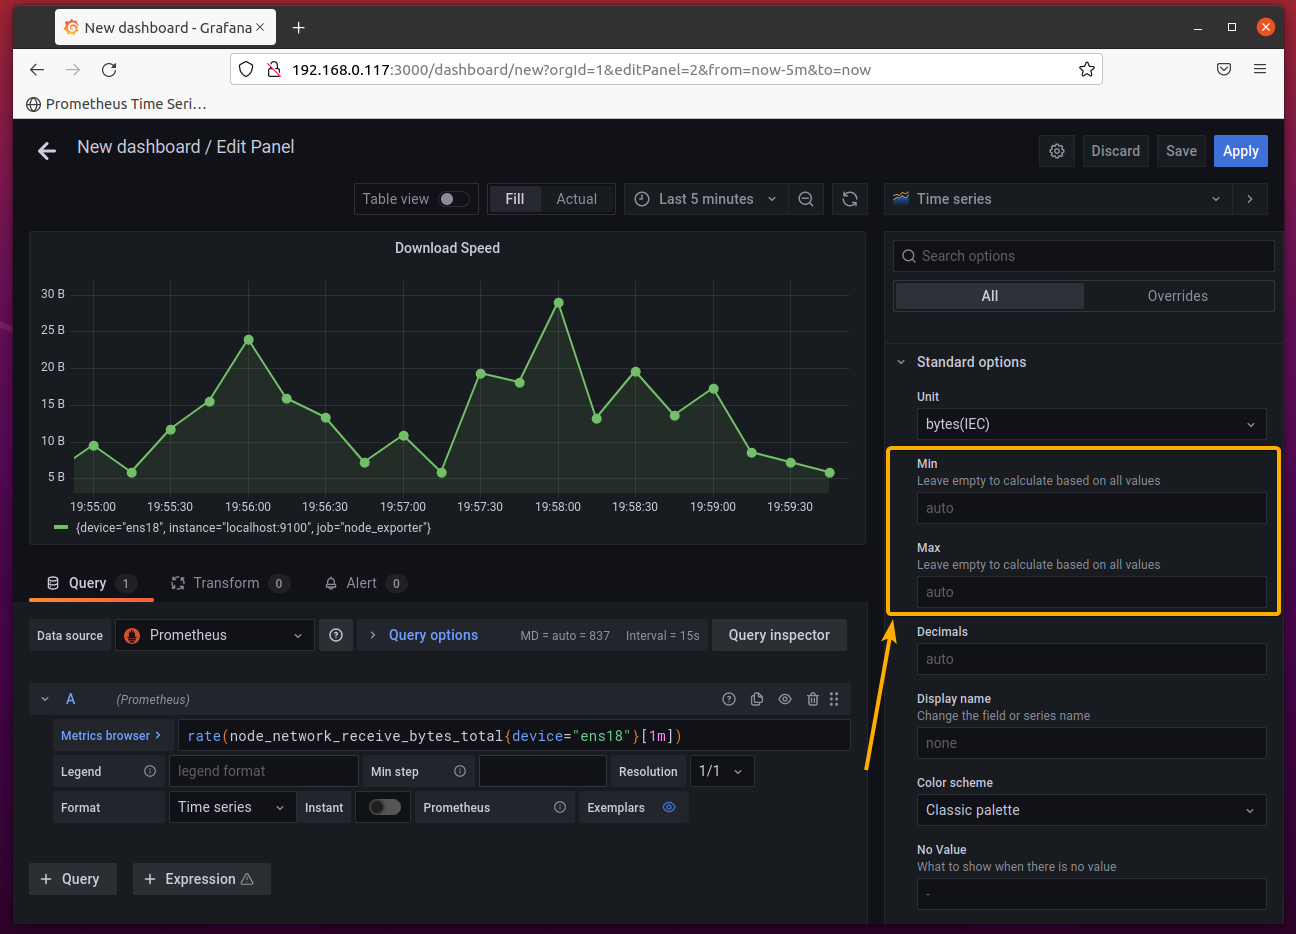
If you know the low and high limits of the data, you can set a minimum and maximum value for the graph as well. This way, each data point of the graph will be displayed within that range. Otherwise, Grafana will automatically determine and set the best minimum and maximum value for the graph.
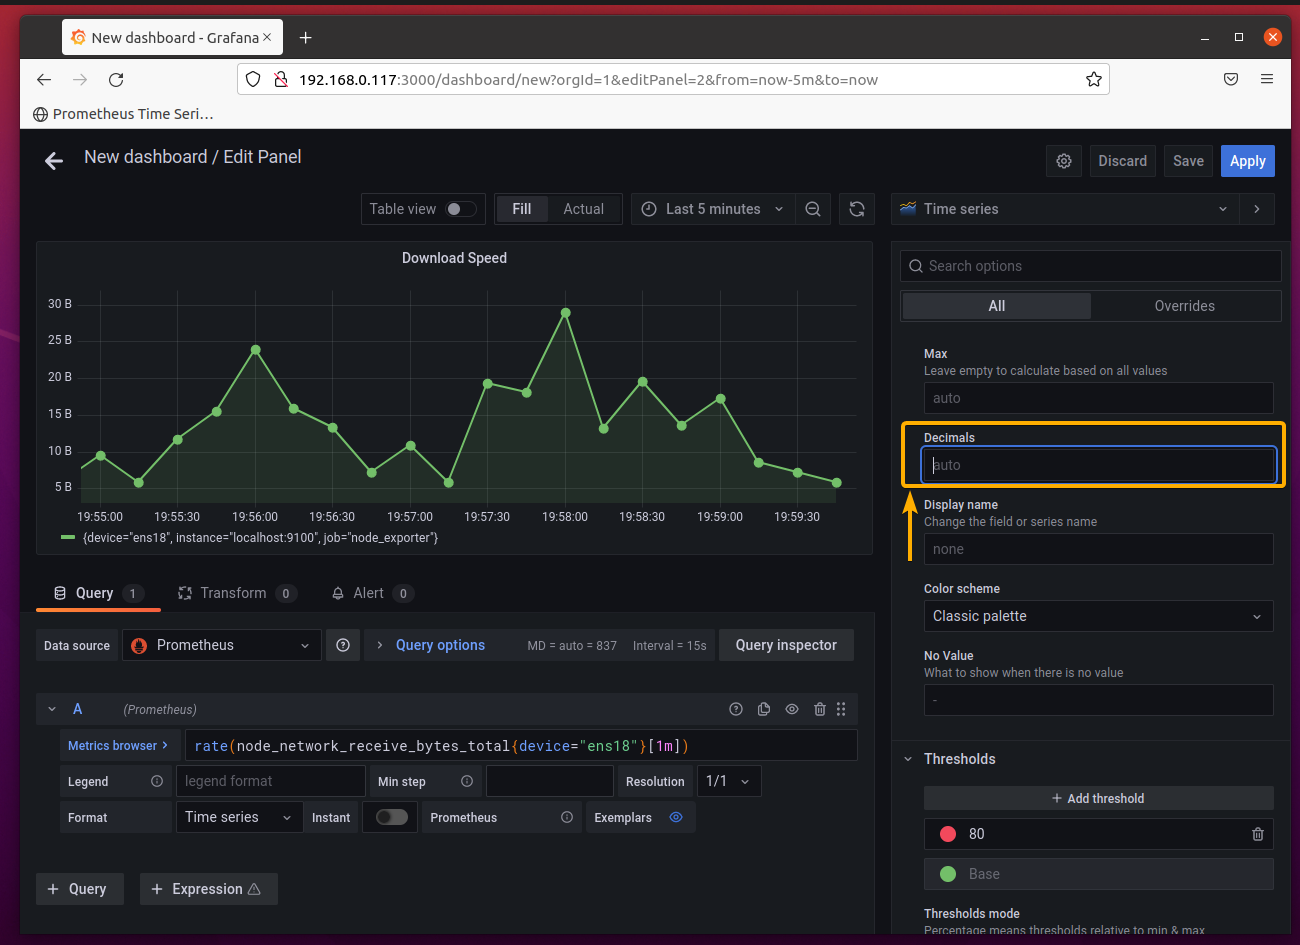
If the data points are fractional numbers instead of integers, you can set the number of decimal digits that you would like to see in the graph. If you set Decimals to 1, you will see only 1 decimal digit (i.e., 17.3kiB, 1.2GiB) on the graph. In the same way, if you set it to 2, you will only see 2 decimal digits (i.e., 45.22 kiB, 75.32 GiB) on the graph, and so on.
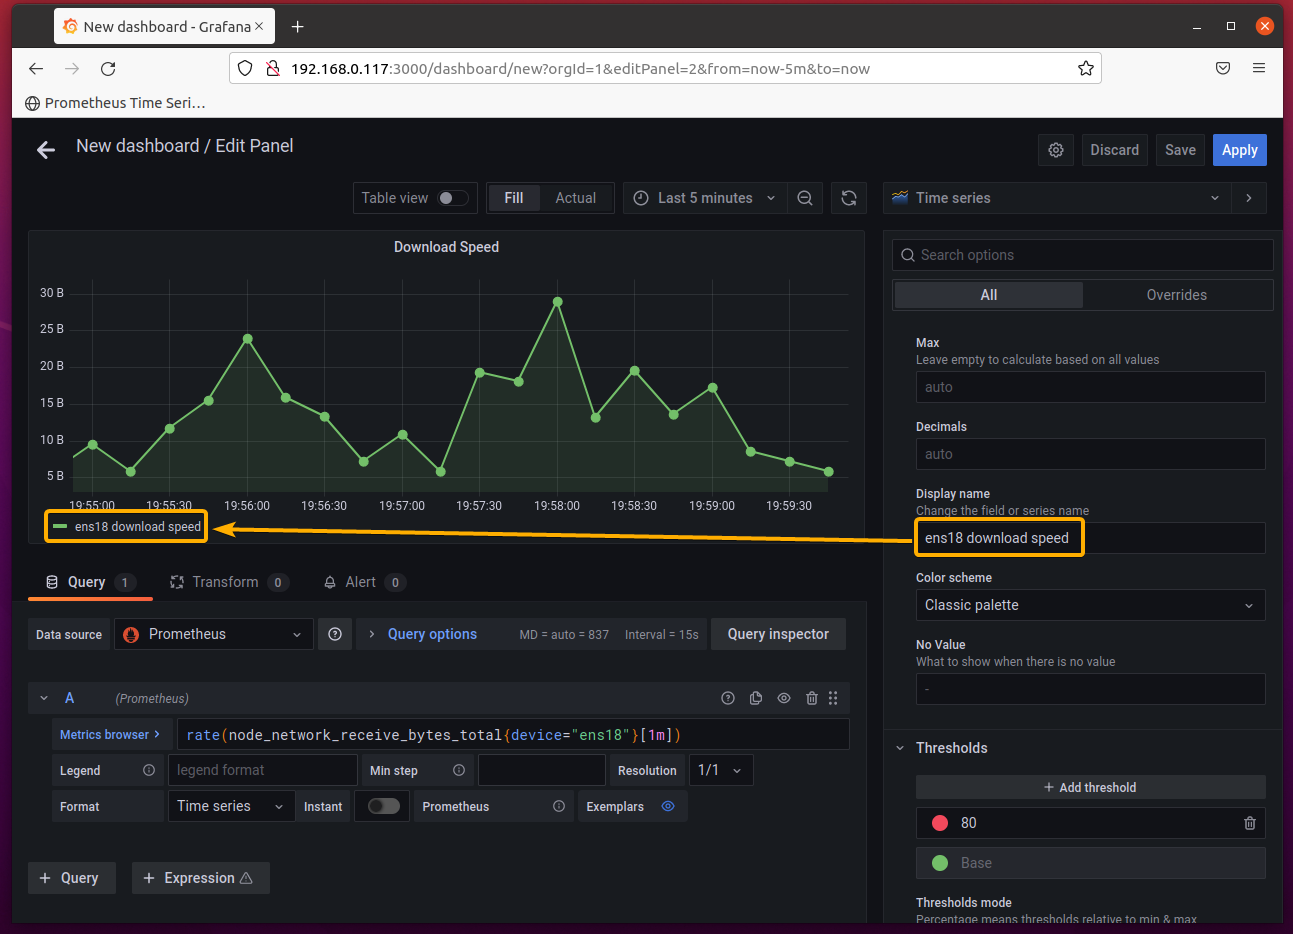
You can also set a display name for the graph property in the Display name section, as marked in the screenshot below.
I will set it to ens18 download speed as I am monitoring the download speed of the ens18 network interface.
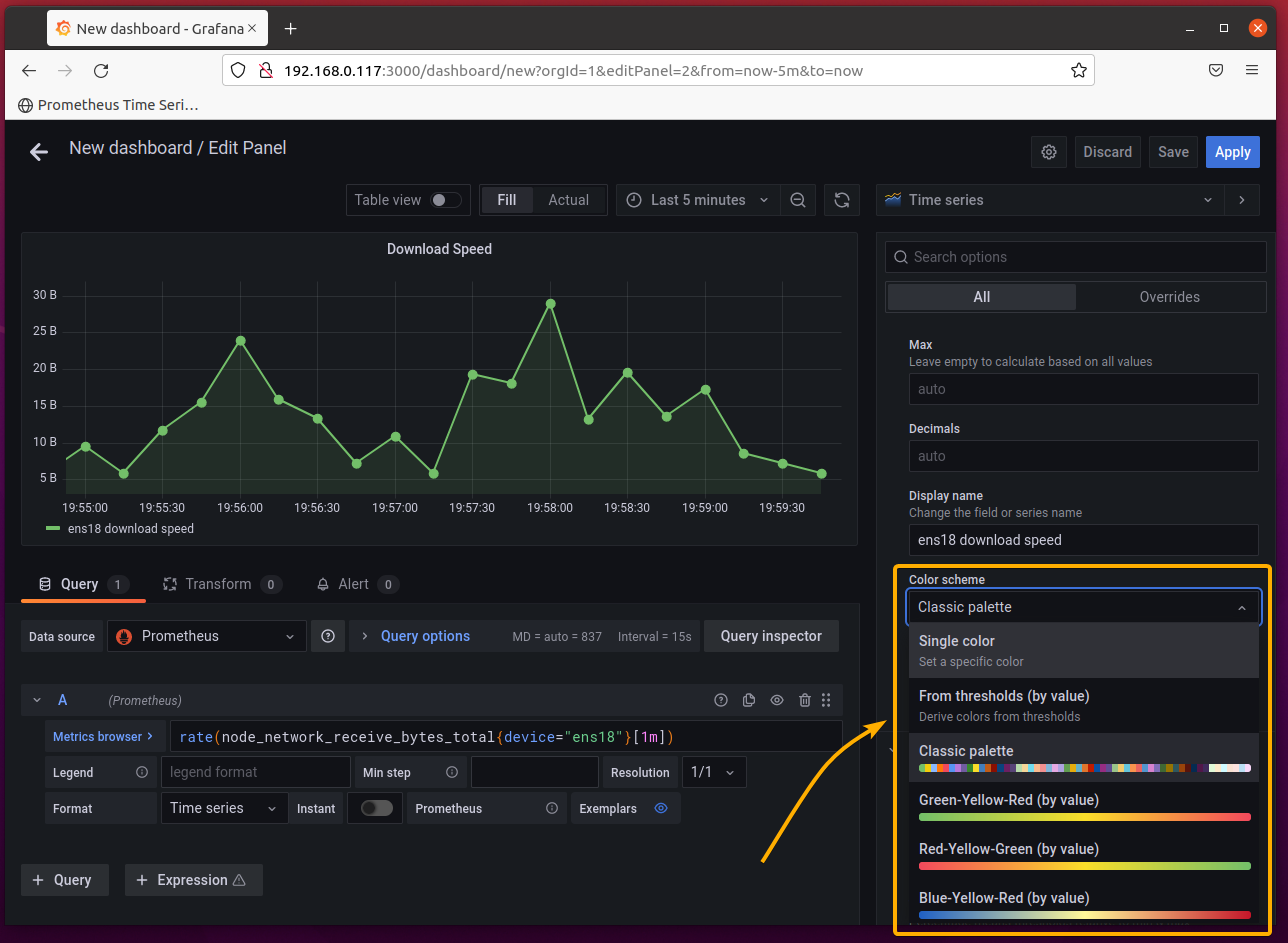
You can set a color scheme for the graph from the Color scheme section as well. There are many options; you can select the one you like from the dropdown menu as marked in the screenshot below.
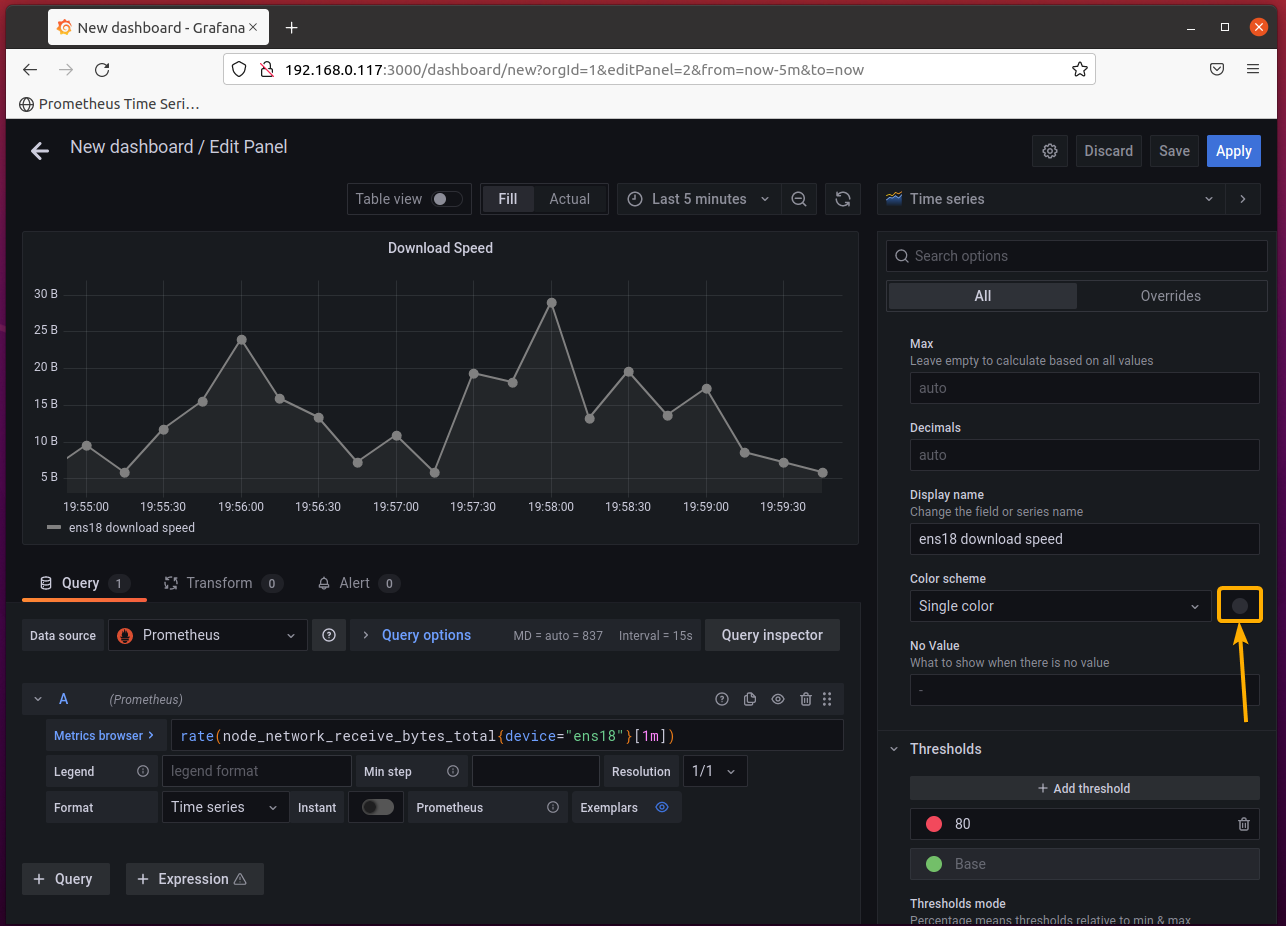
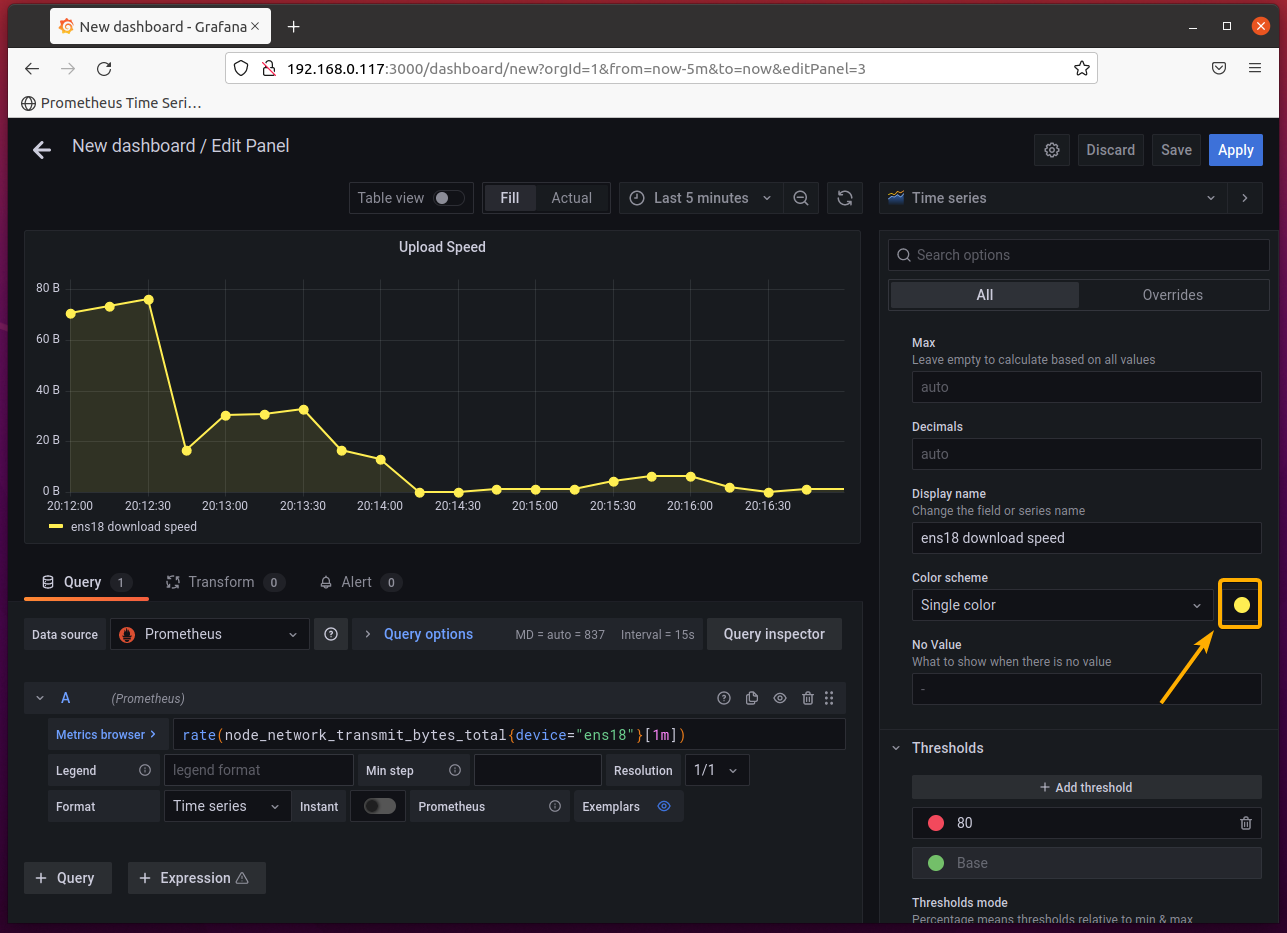
To set a specific color for the graph, select Single color from the Color Scheme section and click on the color picker to select a color as marked in the screenshot below.
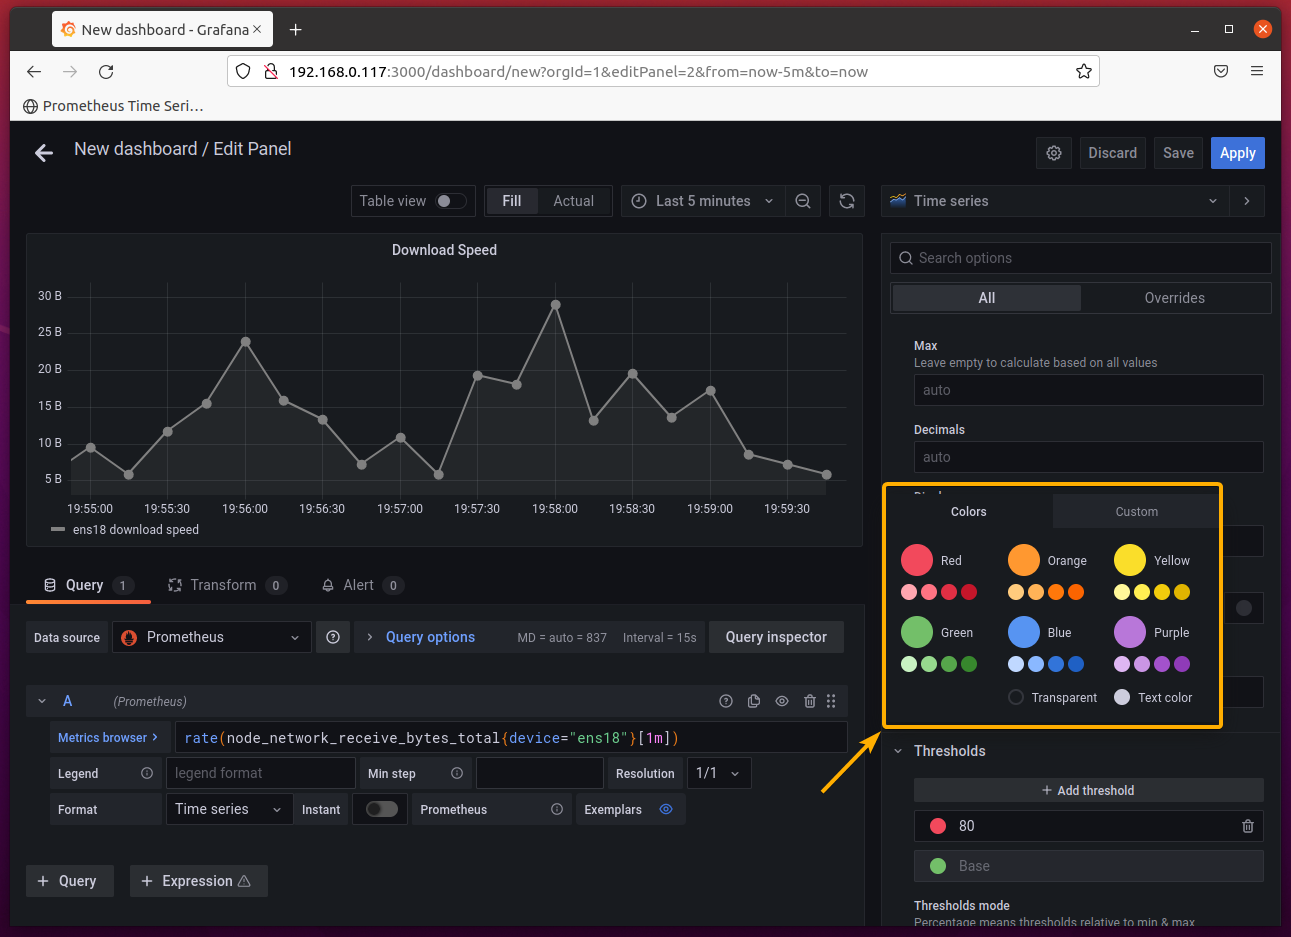
You can select one of the predefined colors, or you can select a Custom color from here.
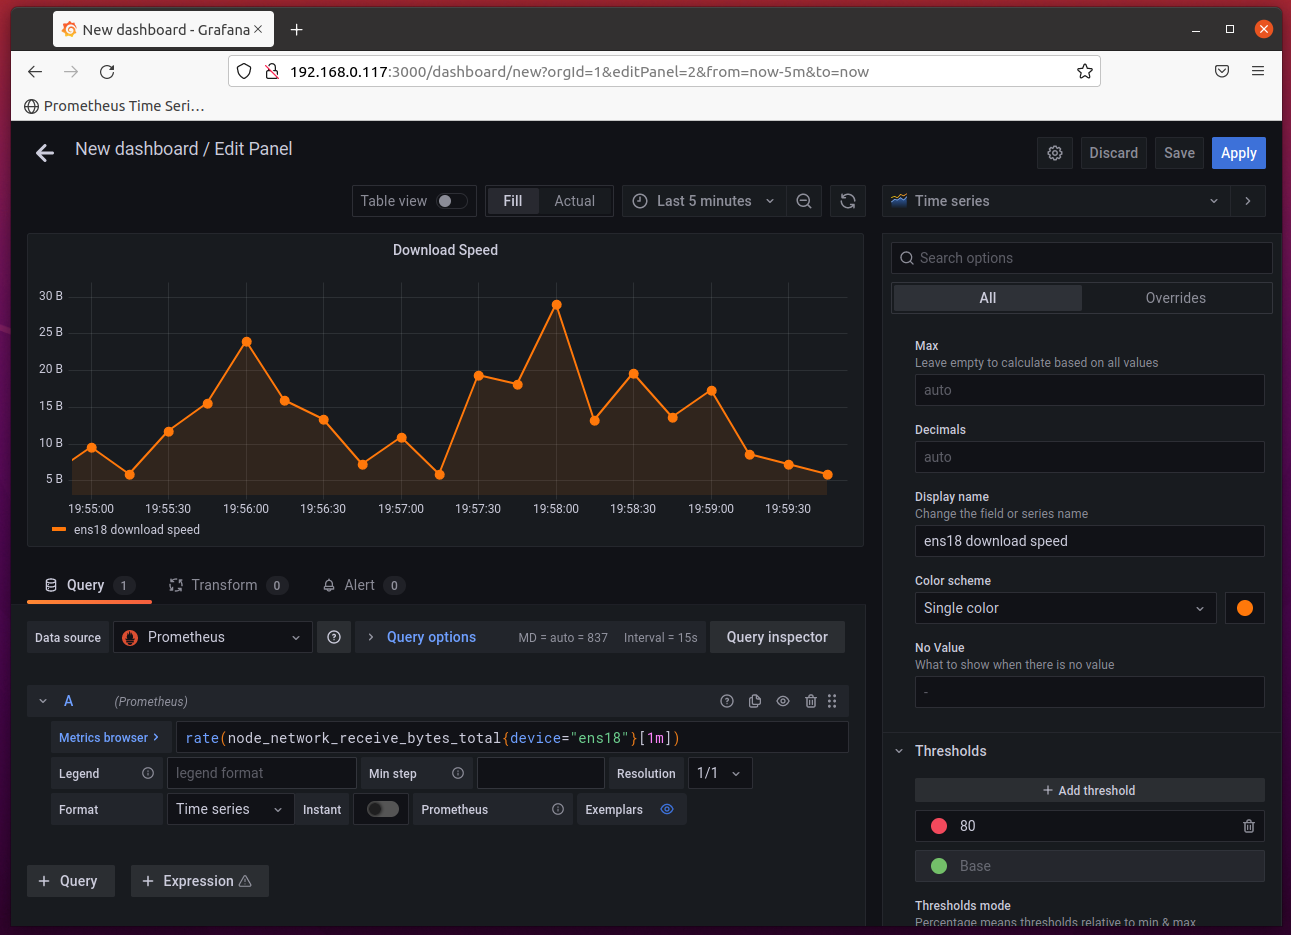
I have selected a shade of orange for the graph, as you can see in the screenshot below.
Once you’re happy with the results, click on Apply as marked in the screenshot below to add the panel to the dashboard.
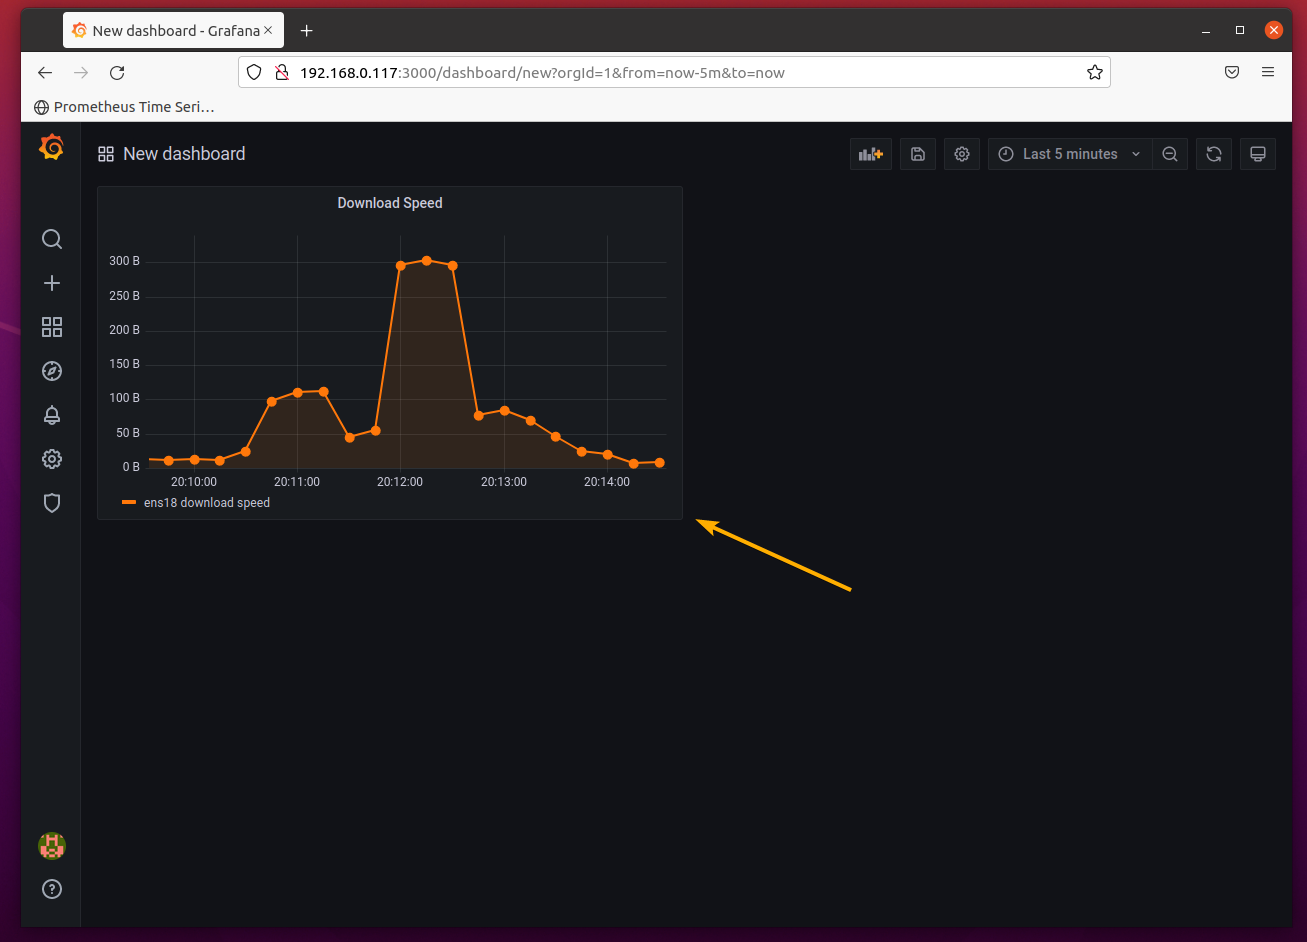
The panel Download Speed should be added to the Dashboard, as shown in the screenshot below.
Now that you have created a panel for monitoring the download speed of the network interface ens18, you may also want to create a new panel for monitoring the upload speed of the network interface ens18 (let’s say).
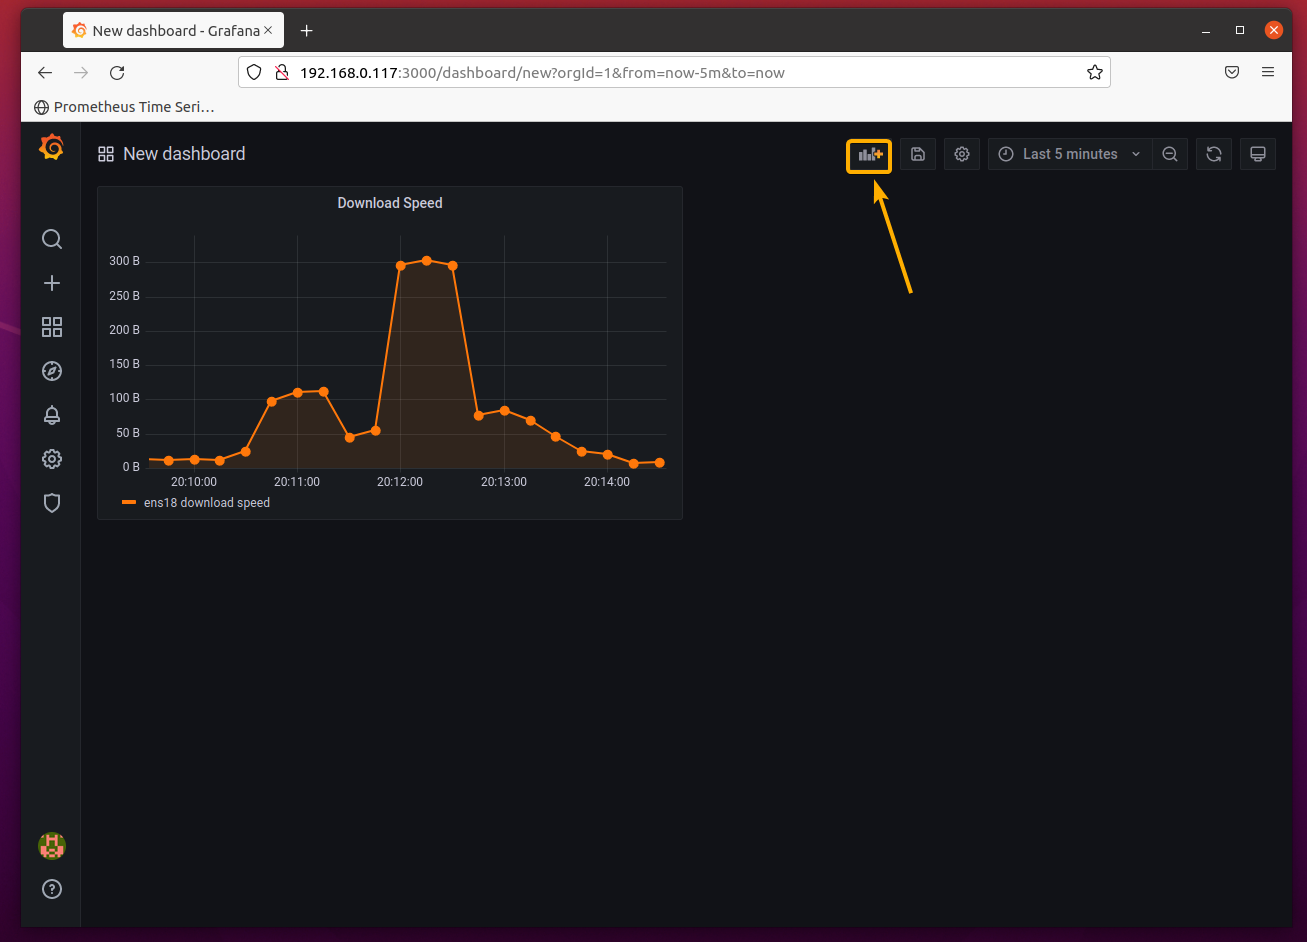
To do that, you can click on the Add icon () as marked in the screenshot below and redo the same thing as you have done for adding the Download Speed panel to the Dashboard.
As the Upload Speed panel you want to create will have almost all the same attributes as the Download Speed panel you’ve created, an easy way to do it would be to clone the Download Speed panel.
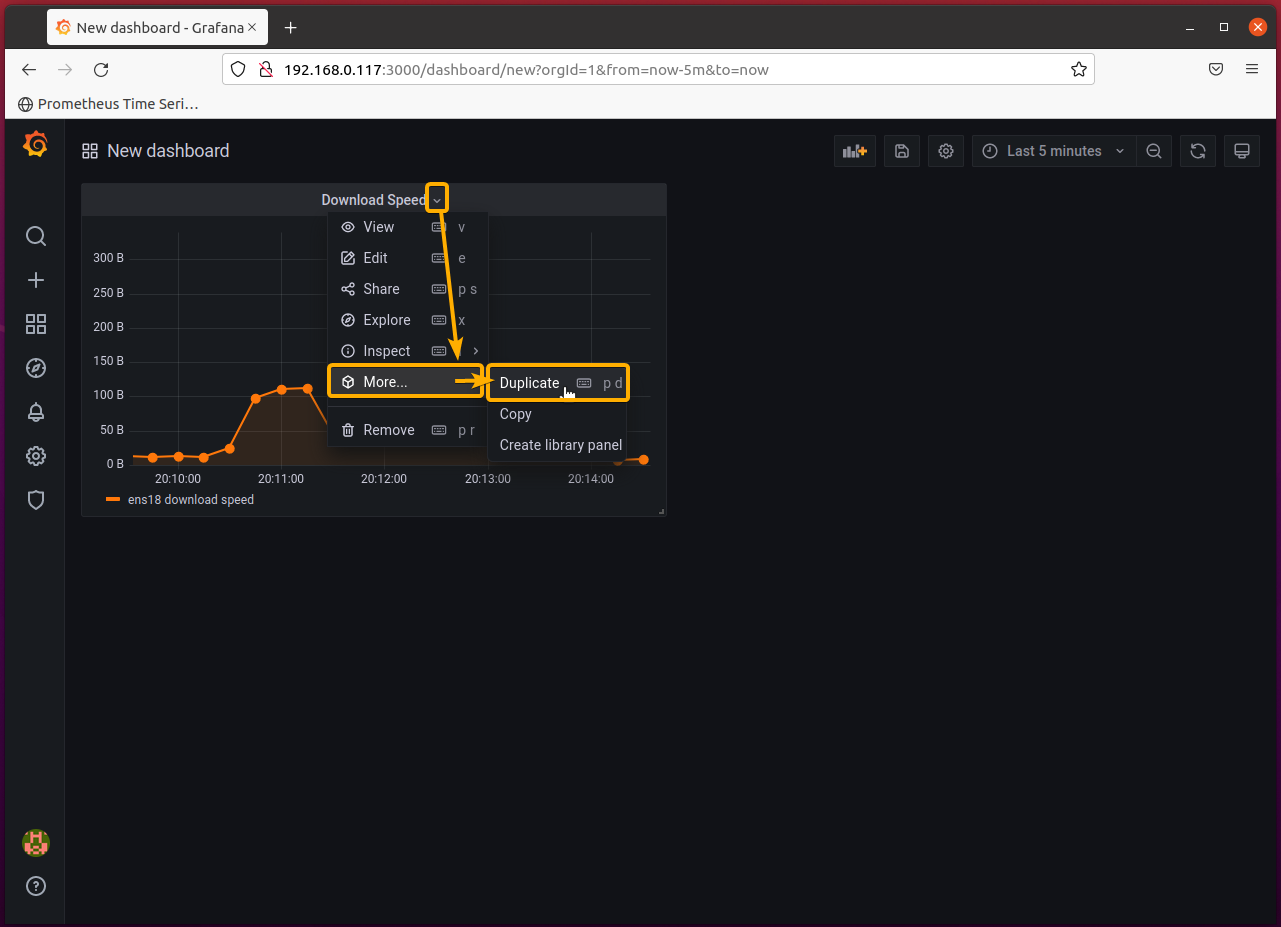
To do that, click on the down arrow icon of the Download Speed panel and click on More… > Duplicate as marked in the screenshot below.
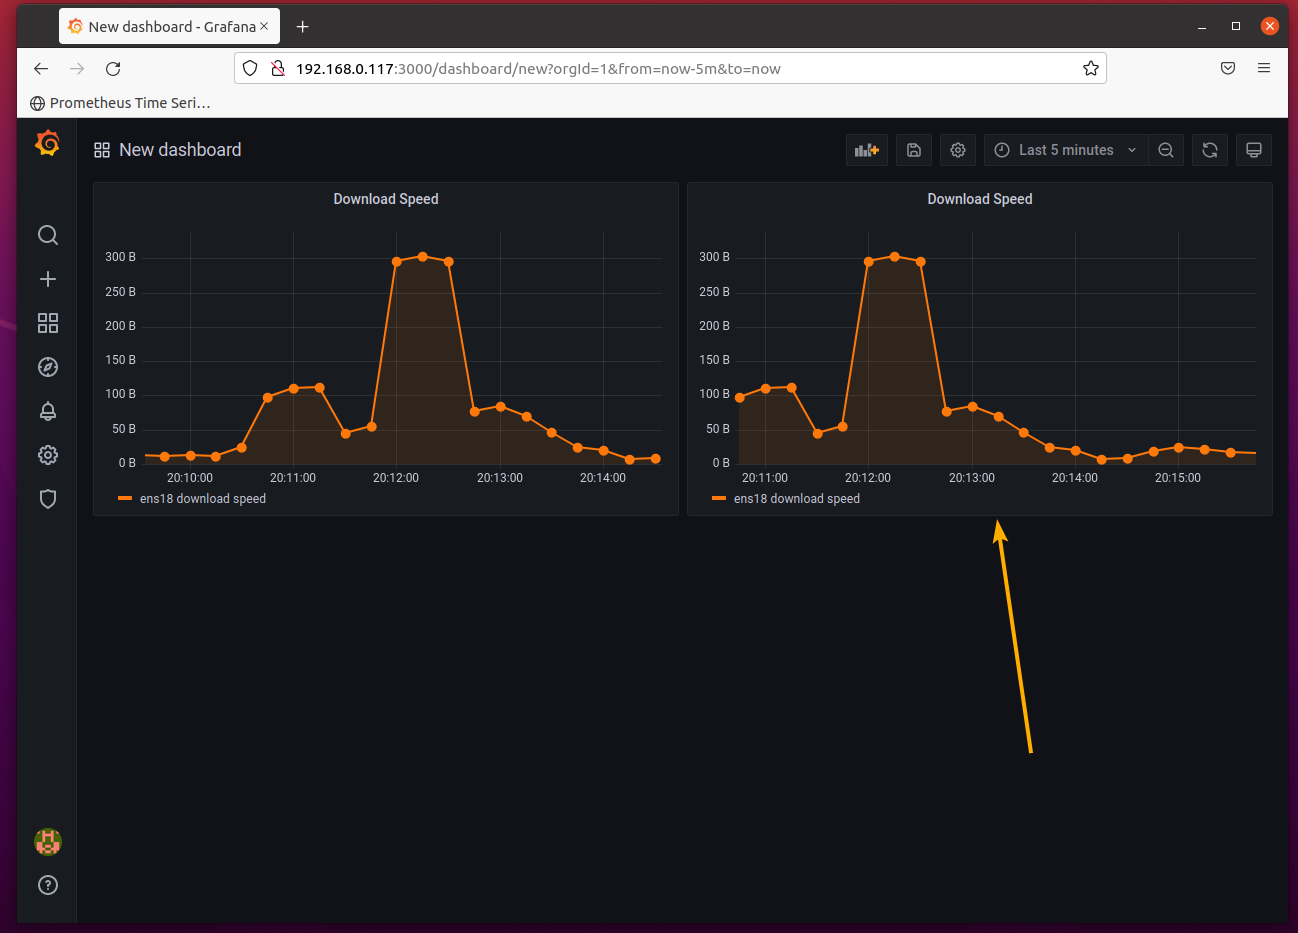
A new Download Speed panel should be created next to the original Download Speed panel, as shown in the screenshot below.
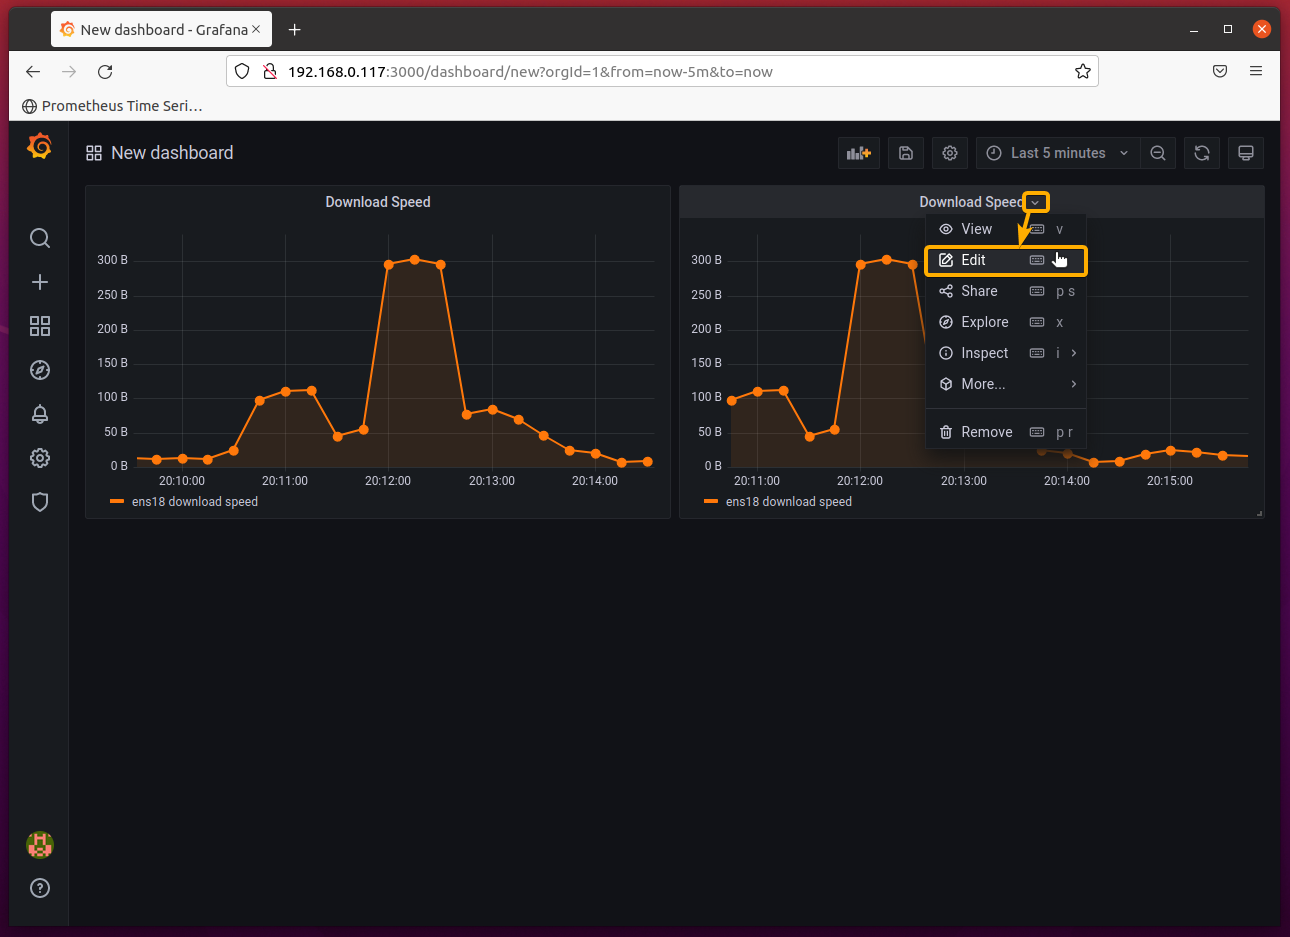
Now, you have to edit the cloned Download Speed panel. To do that, click on the down arrow icon of the cloned Download Speed panel and click on Edit as marked in the screenshot below.
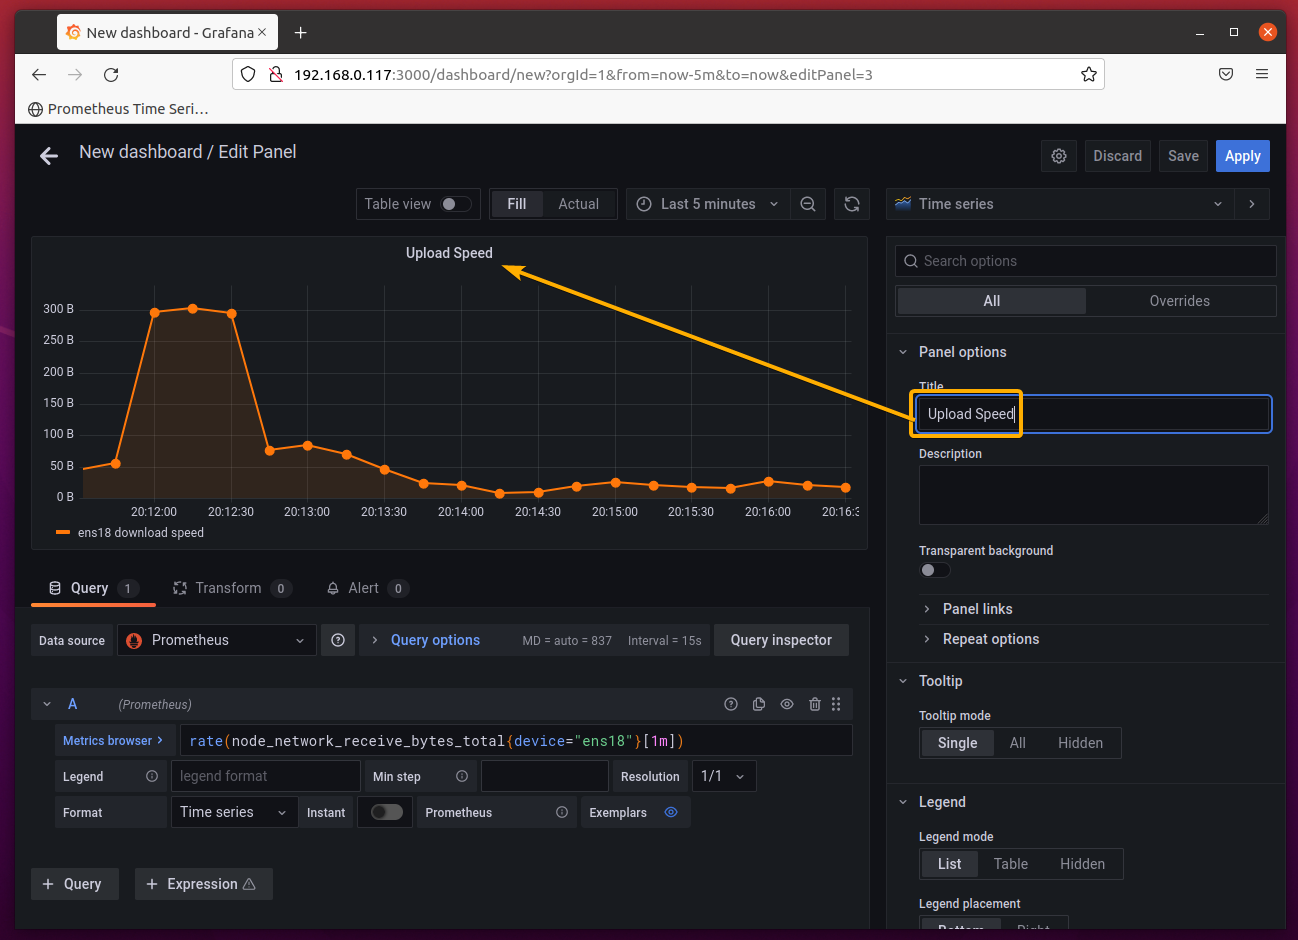
The cloned Download Speed panel should be opened with the Grafana panel editor, as shown in the screenshot below.
First, change the panel title to Upload Speed, as you will be monitoring the upload speed of the network interface ens18.
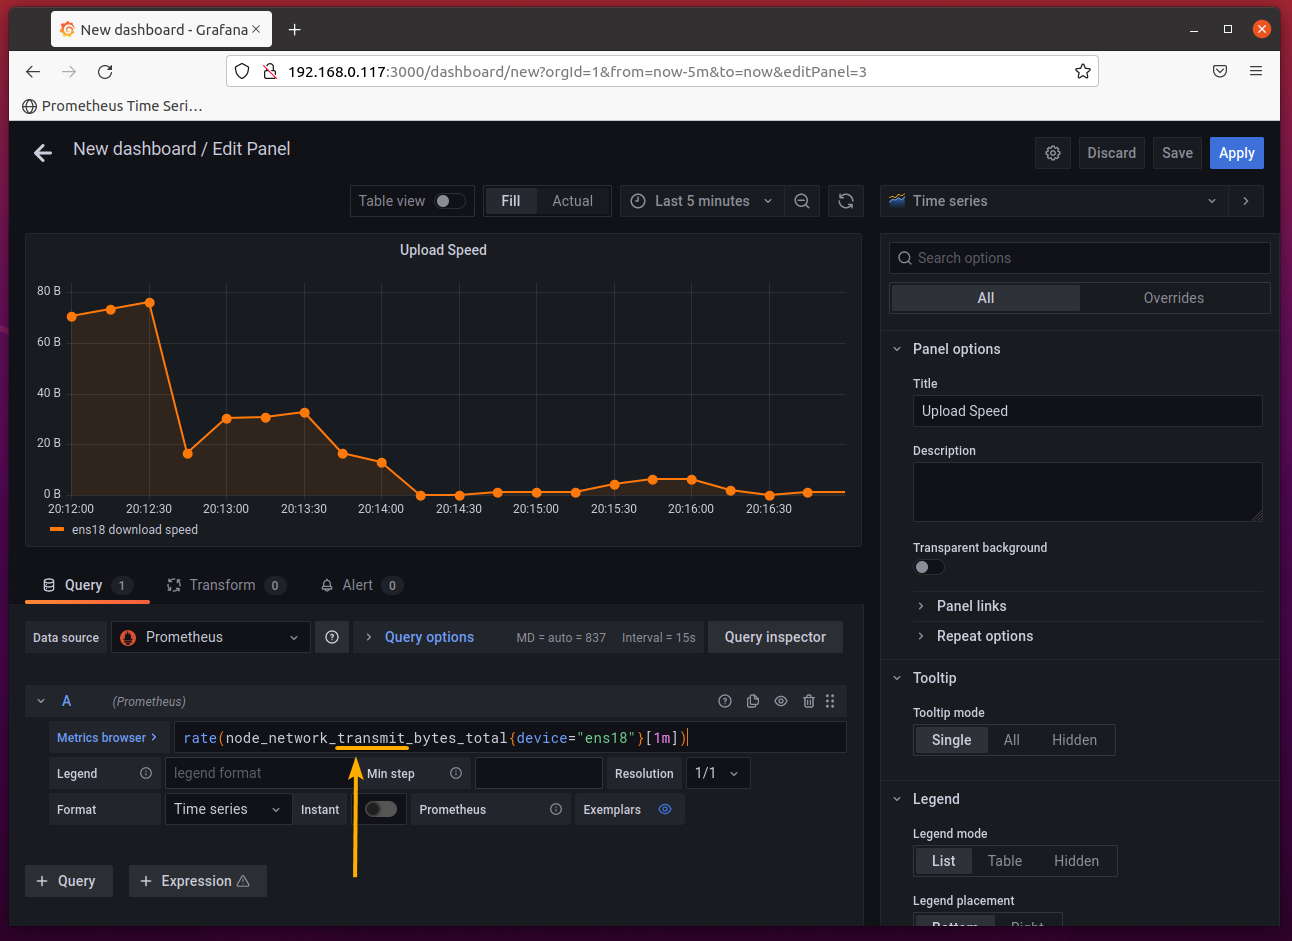
Change node_network_receive_bytes_total to node_network_transmit_bytes_total in the Metrics browser as marked in the screenshot below.
Also, change the color of the graph to something else to give it a little more aesthetics.
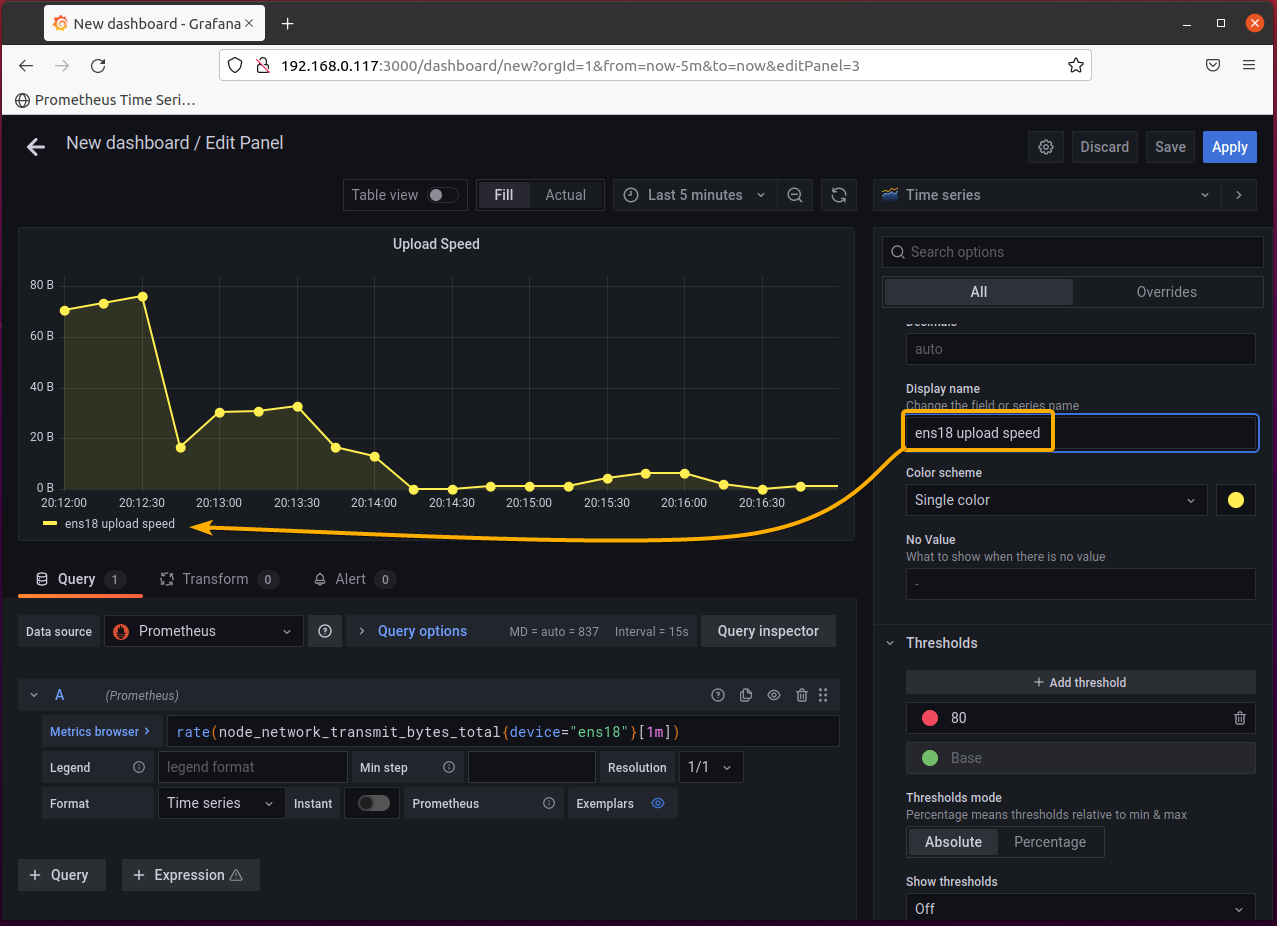
Set the Display name of the graph to ens18 upload speed as you are monitoring the upload speed of the ens18 network interface.
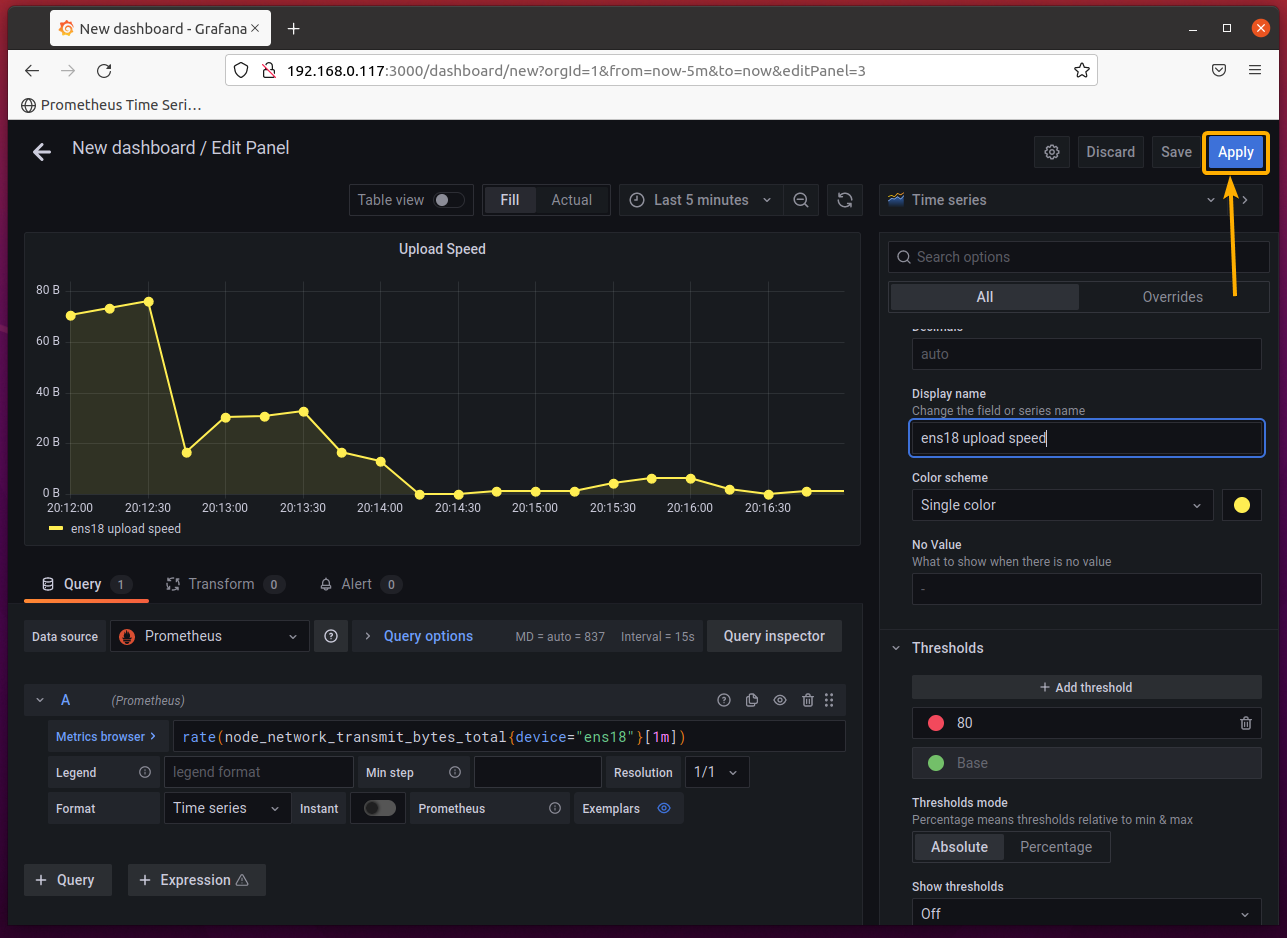
Once you’re done, click on Apply as marked in the screenshot below.
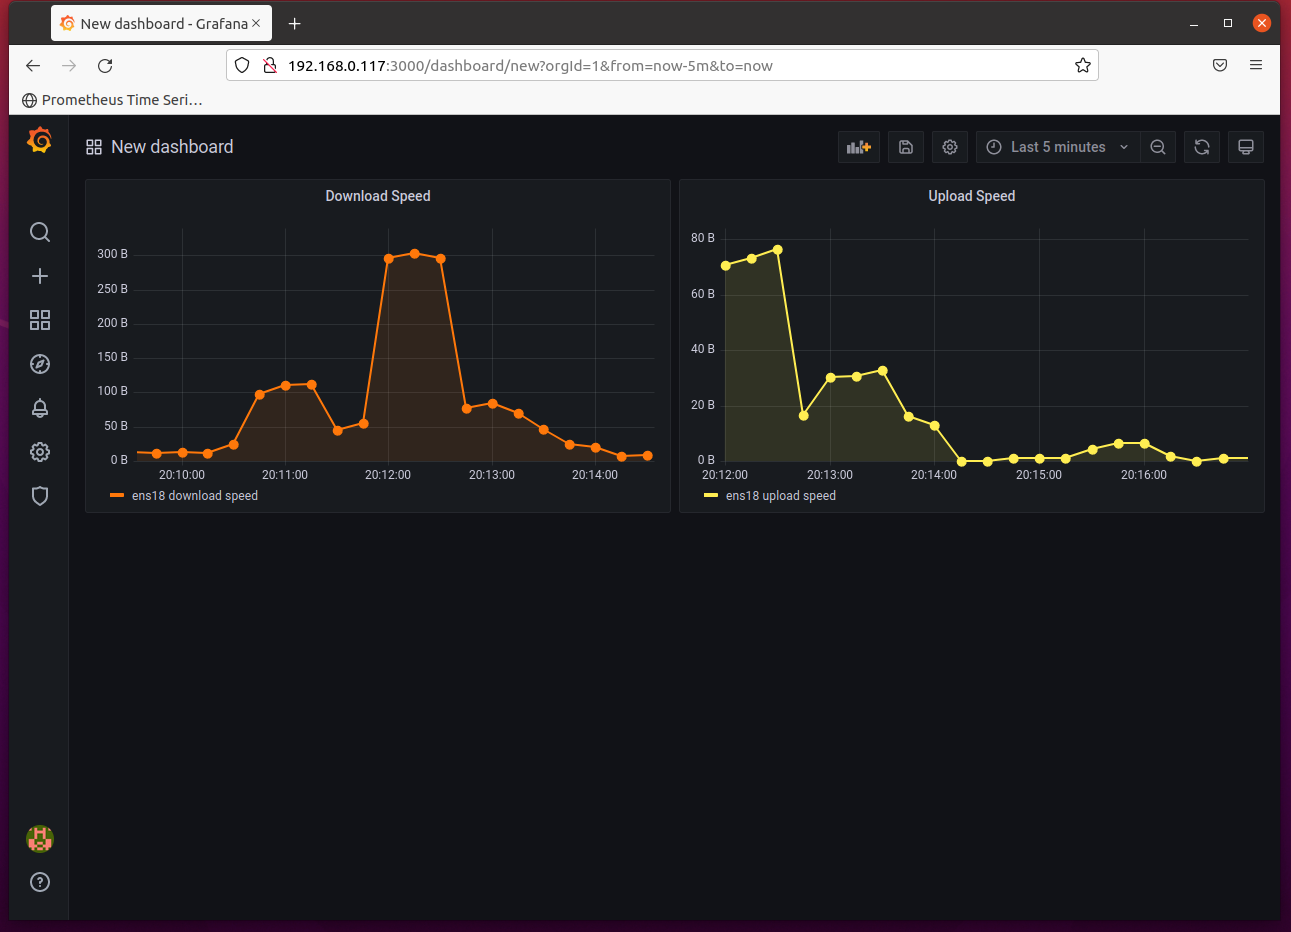
A new panel Upload Speed should be added to the Dashboard, as shown in the screenshot below.
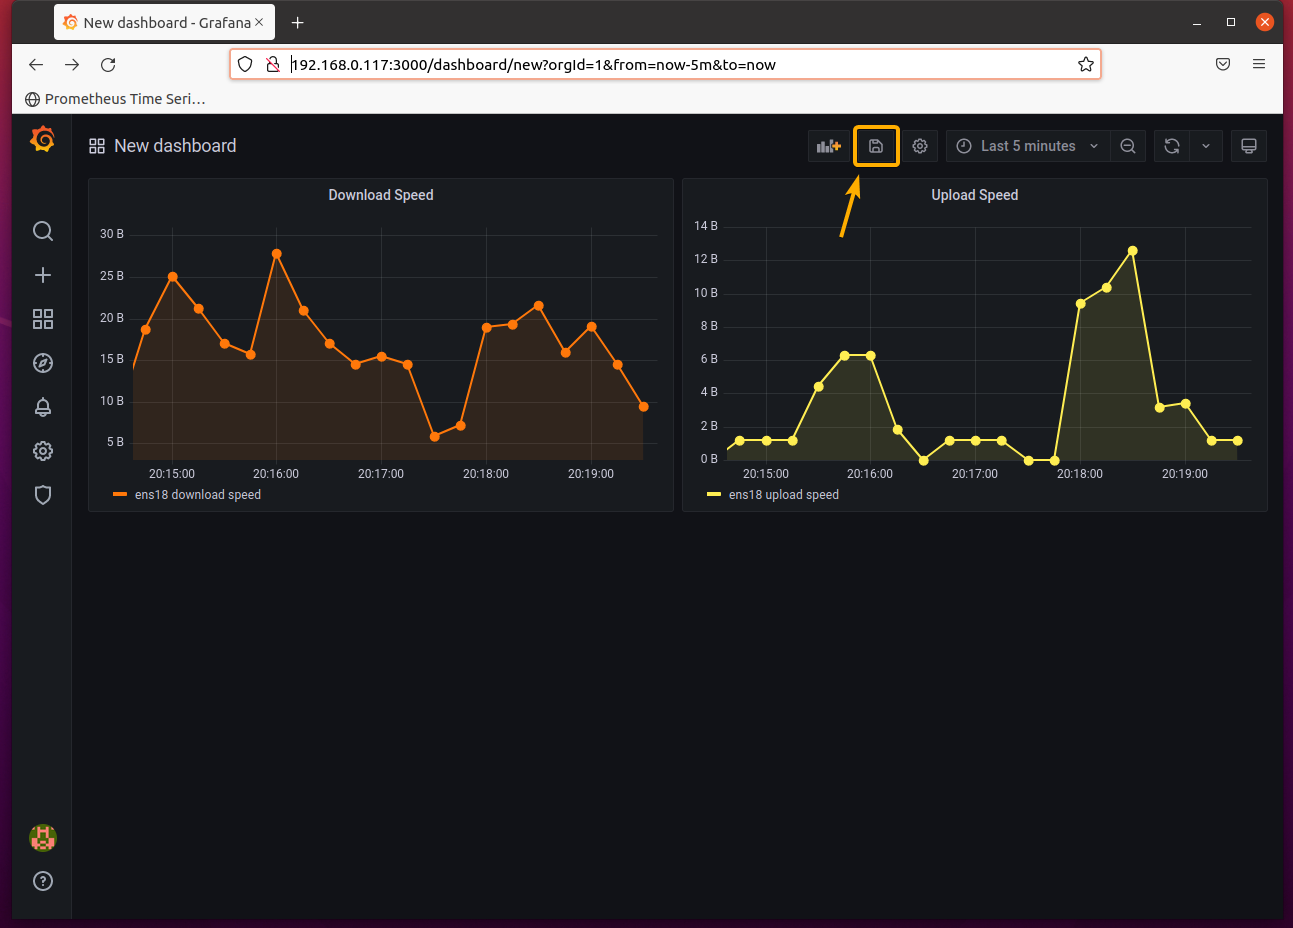
Now, click on the Save icon as marked in the screenshot below to save the Dashboard.
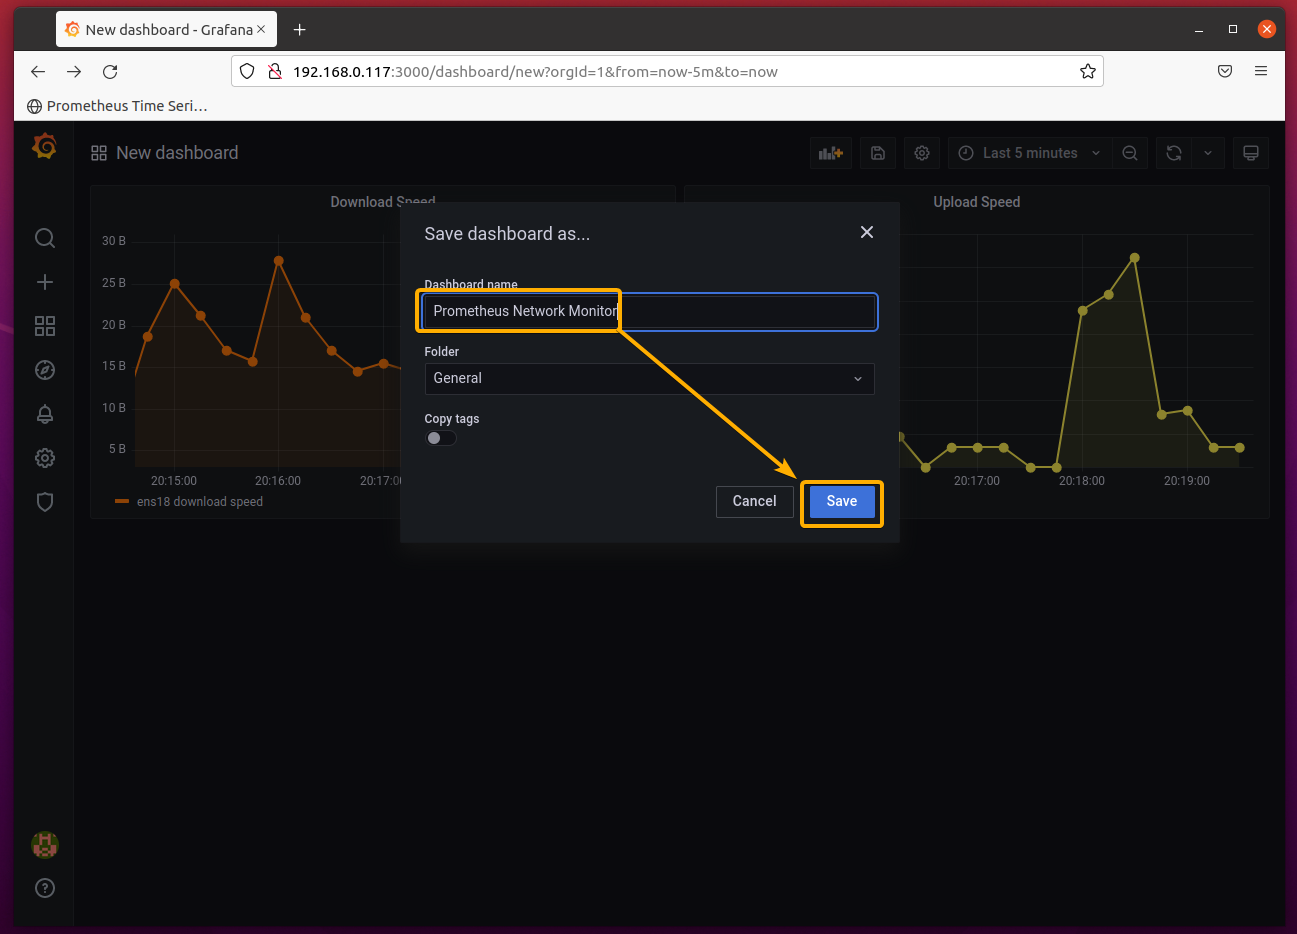
Type in a Dashboard name and click on Save.
I will call it Prometheus Network Monitor. You can call it anything you want.
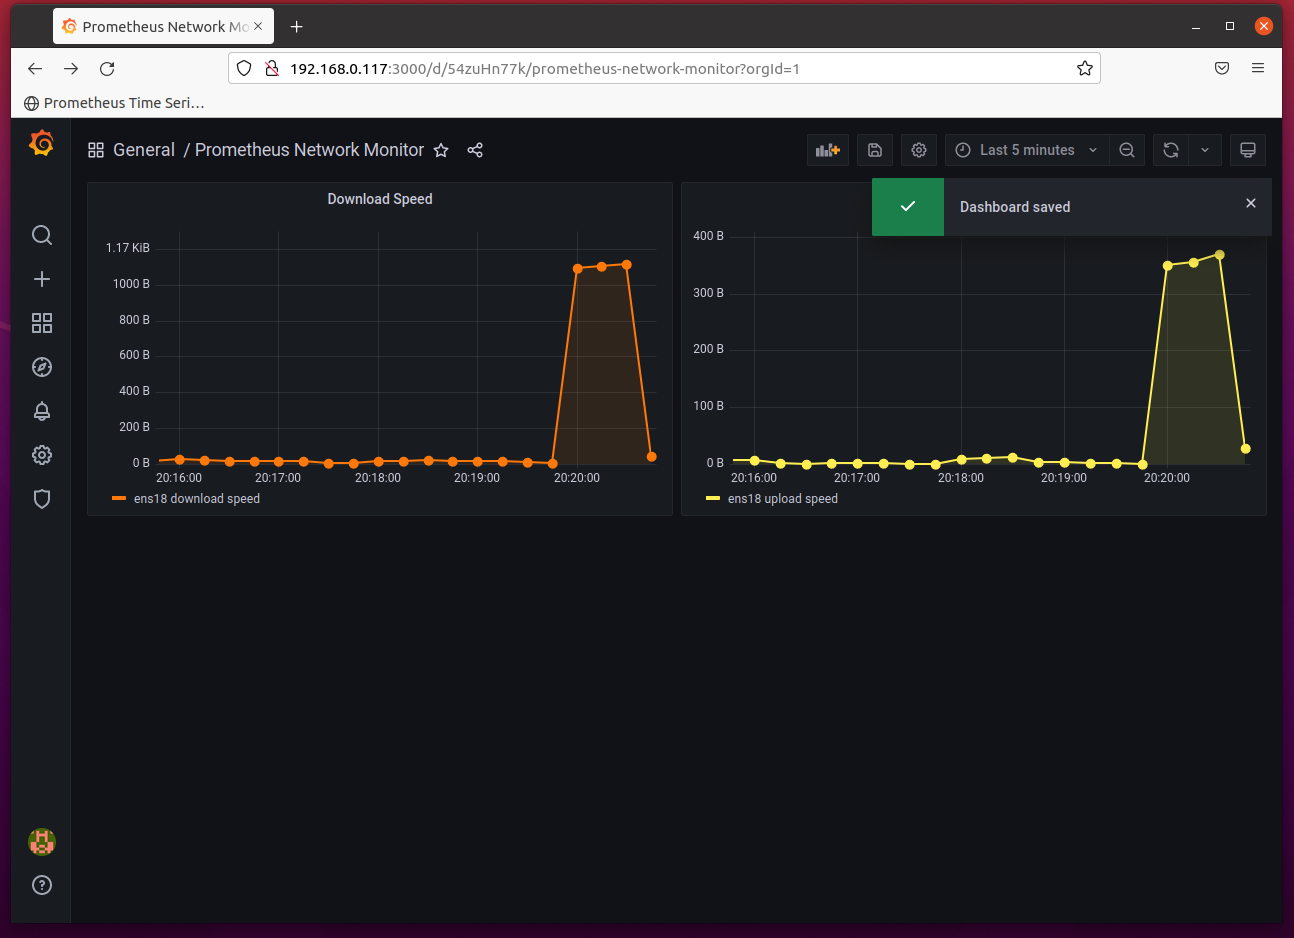
The Dashboard should be saved.
Setting Network Monitoring Dashboard as Default:
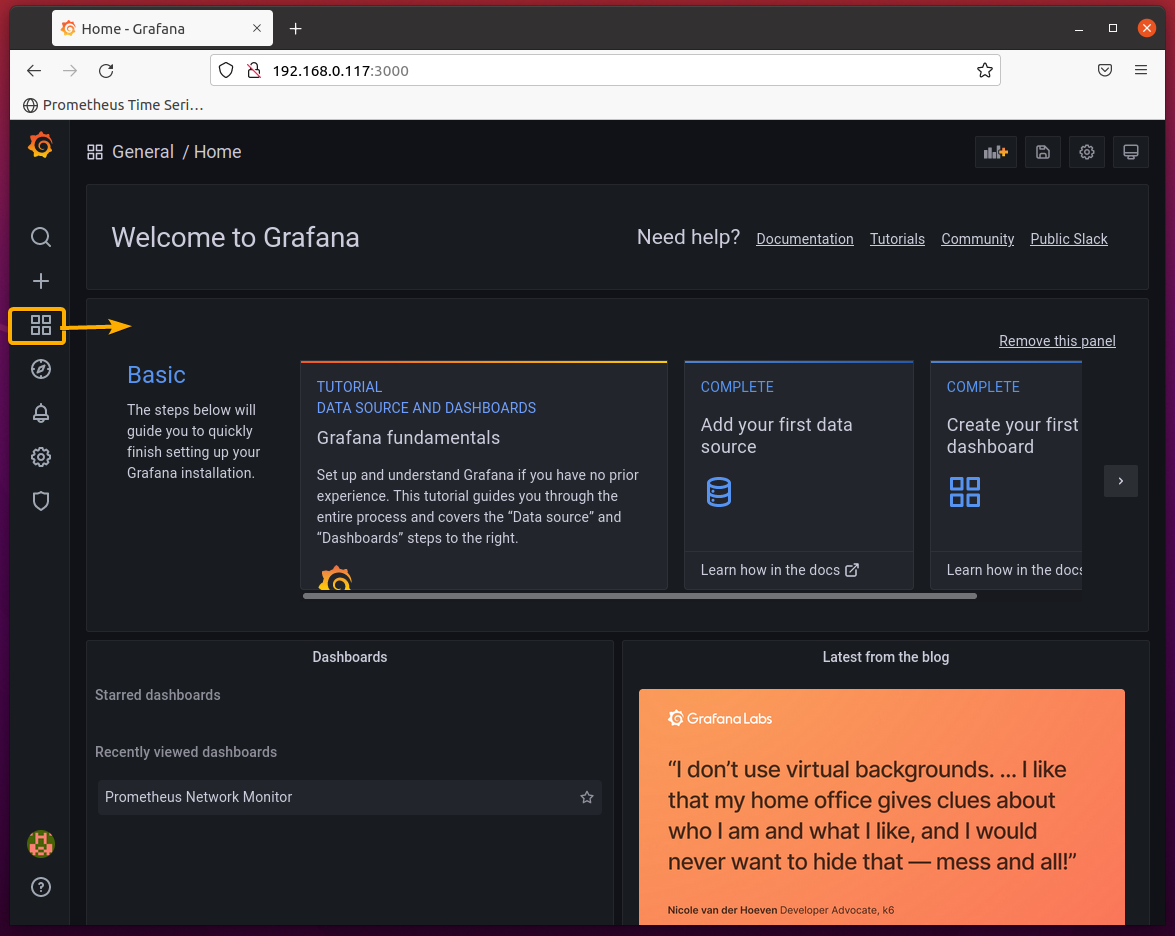
When you click on the Dashboard icon, it shows you the default Grafana Dashboard. I am sure that it is not very helpful to you. The good news is that you can set any Dashboard as the default Grafana Dashboard.
To set a default dashboard, you will have to star the Dashboard.
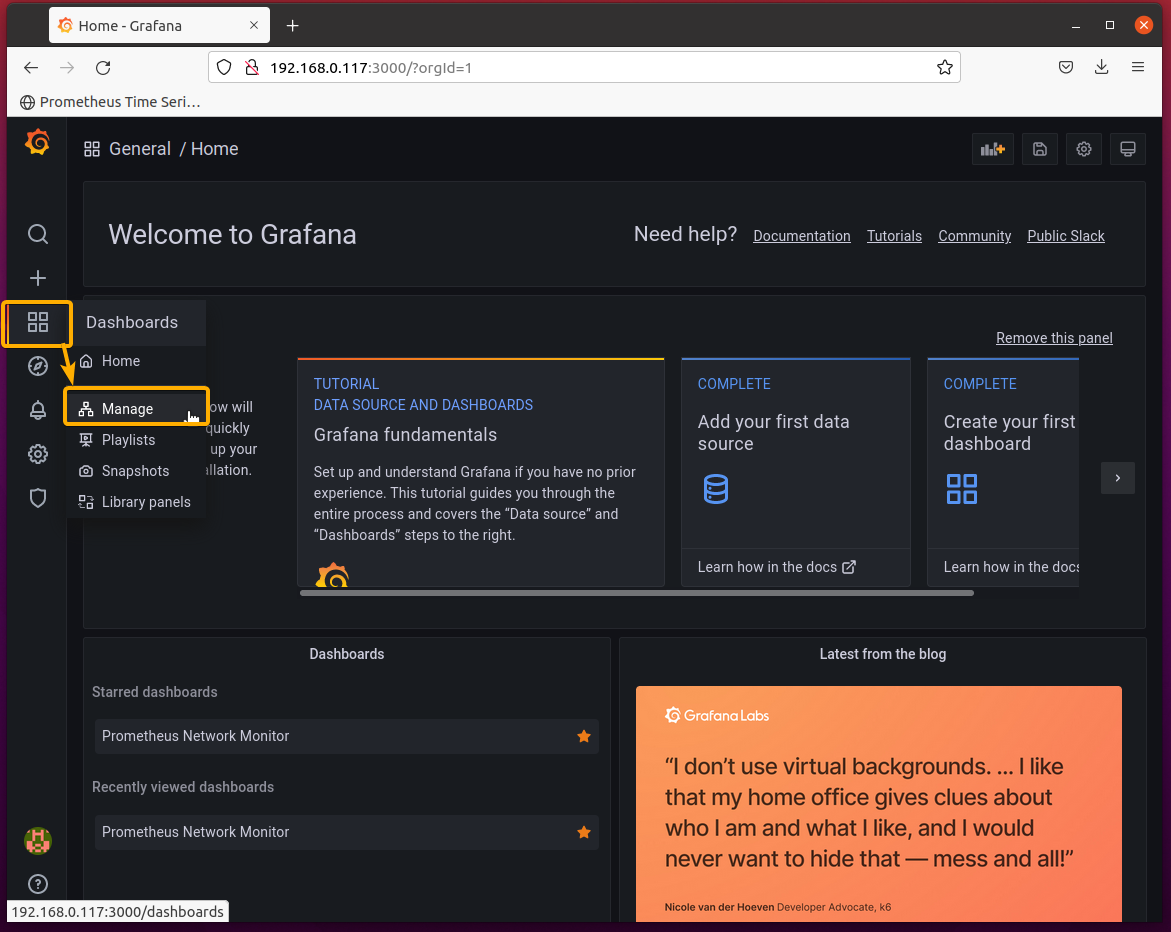
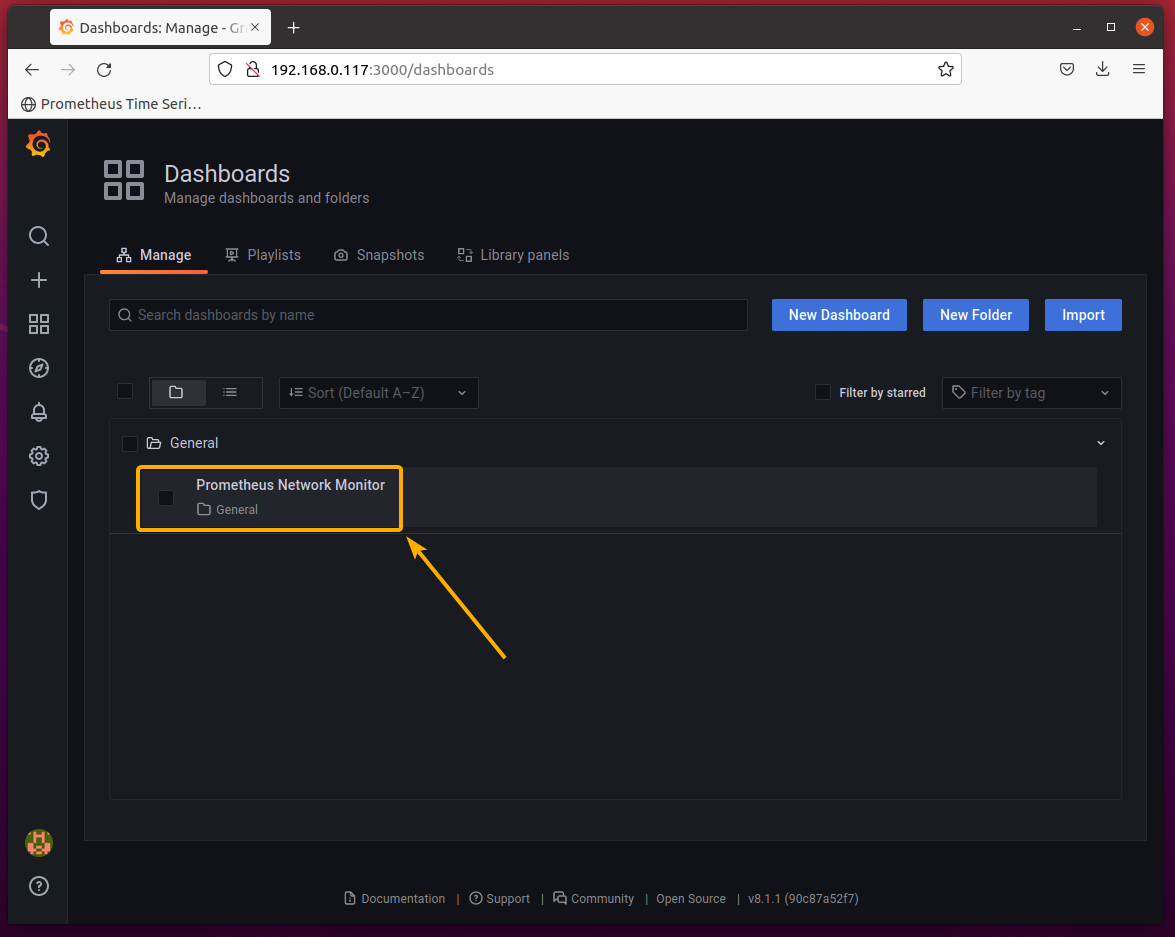
To list all the Dashboards you have created, click on Dashboards > Manage as marked in the screenshot below.
The Dashboard that you’ve created should be listed here. Click on it.
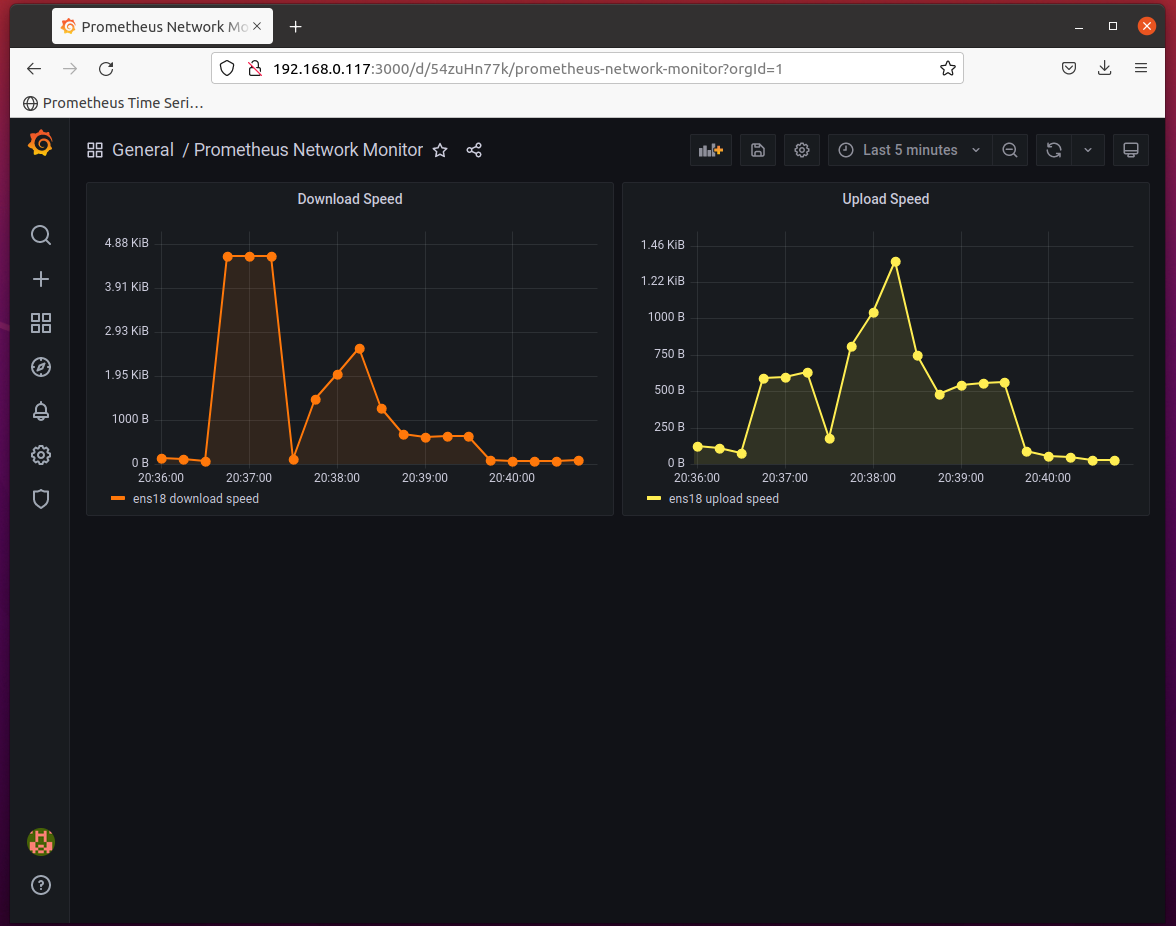
The Dashboard should be opened.
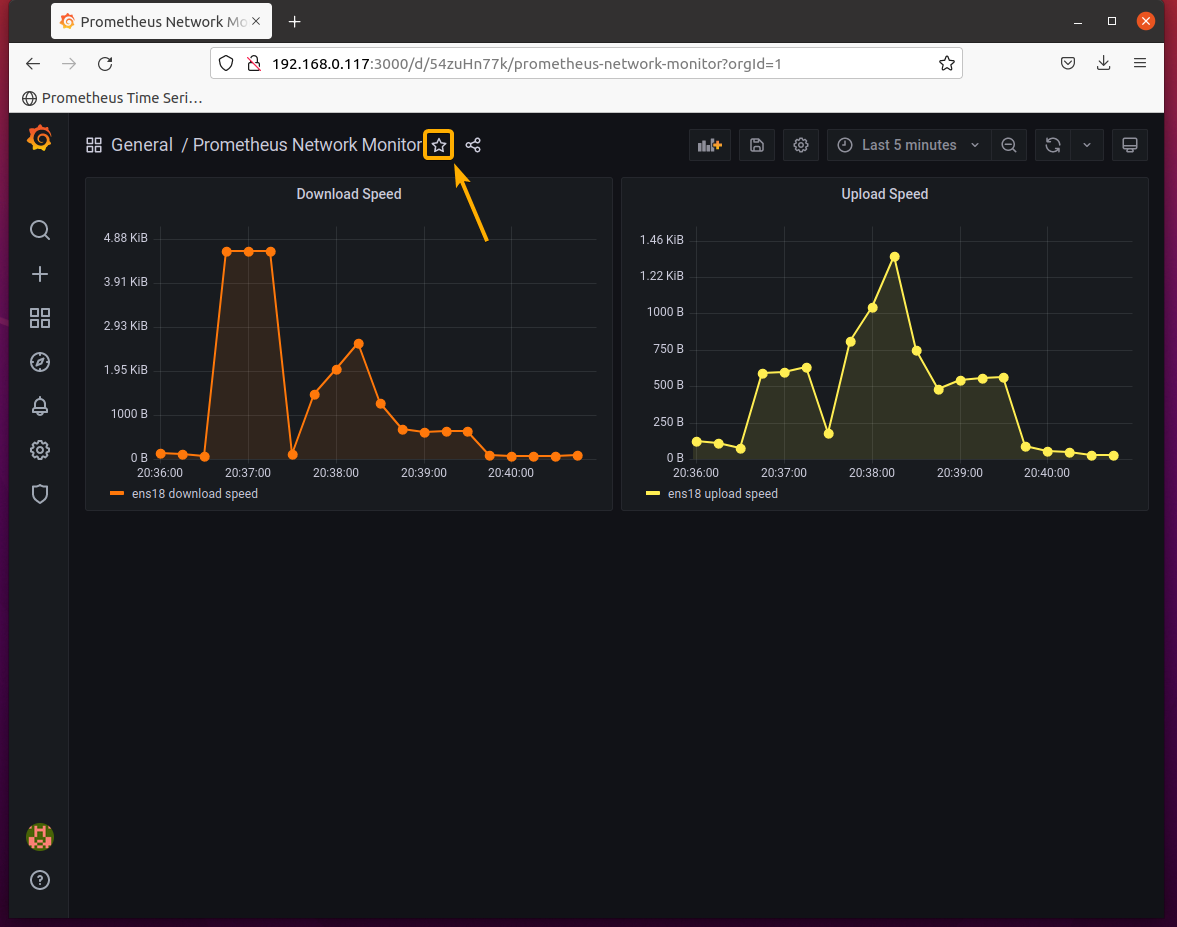
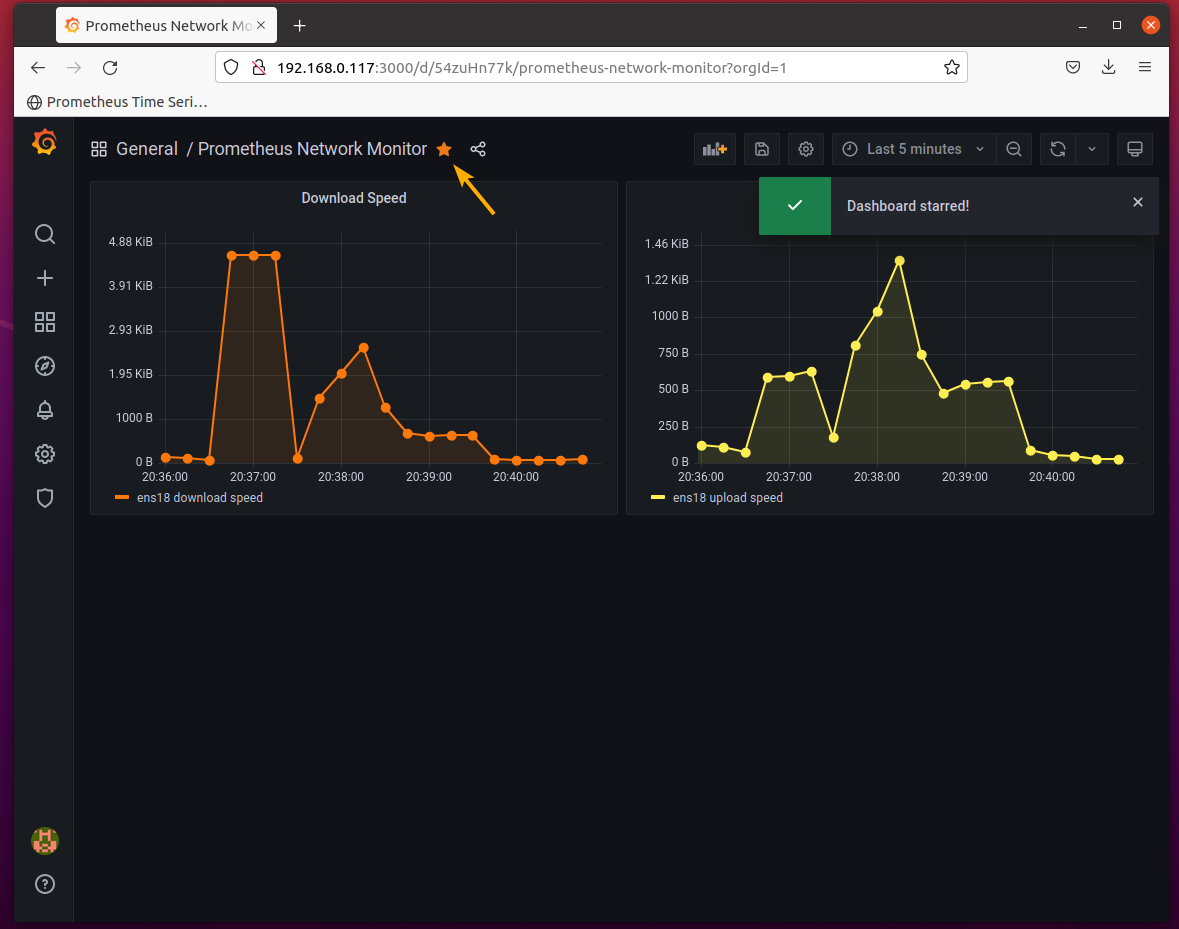
To star the Dashboard, click on the star icon of the Dashboard as marked in the screenshot below.
The Dashboard should be starred.
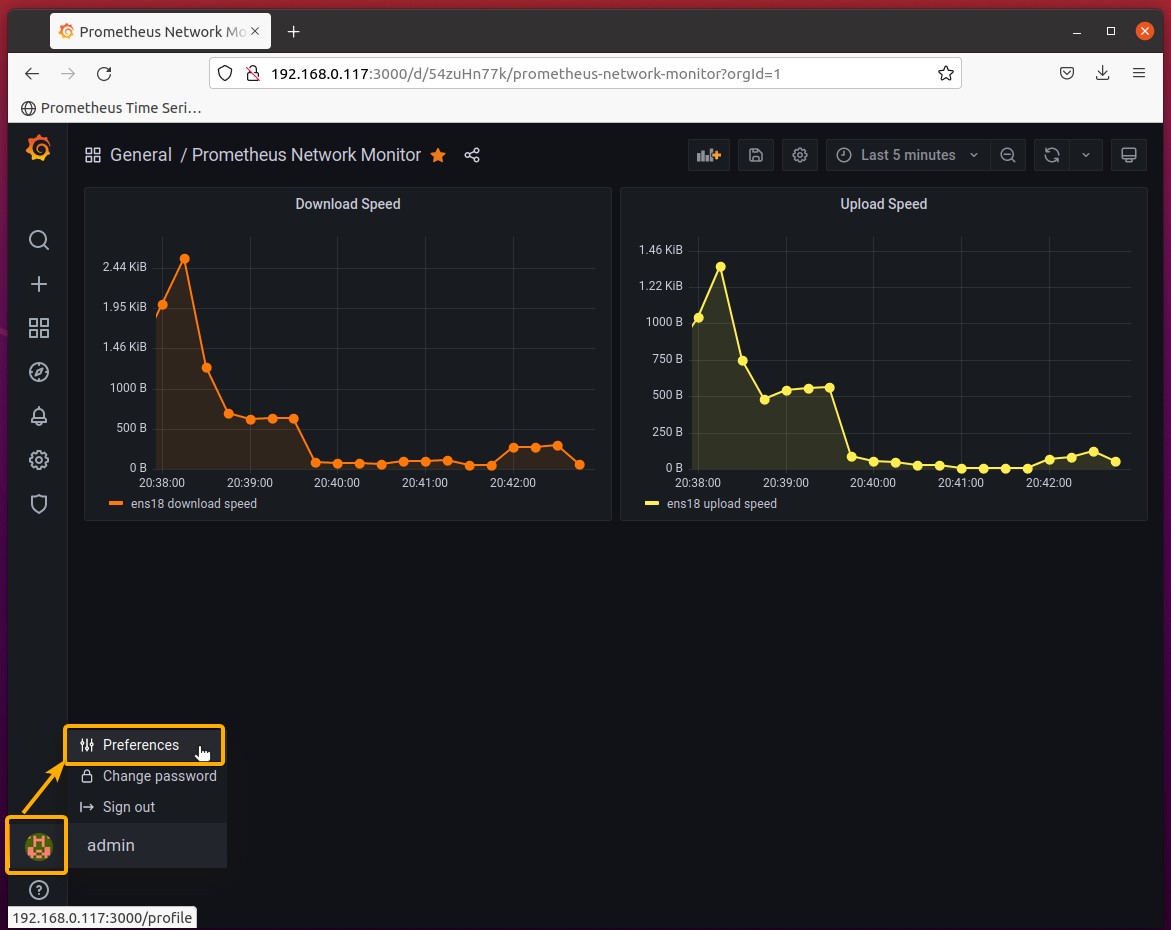
Now, click on Preferences as marked in the screenshot below.
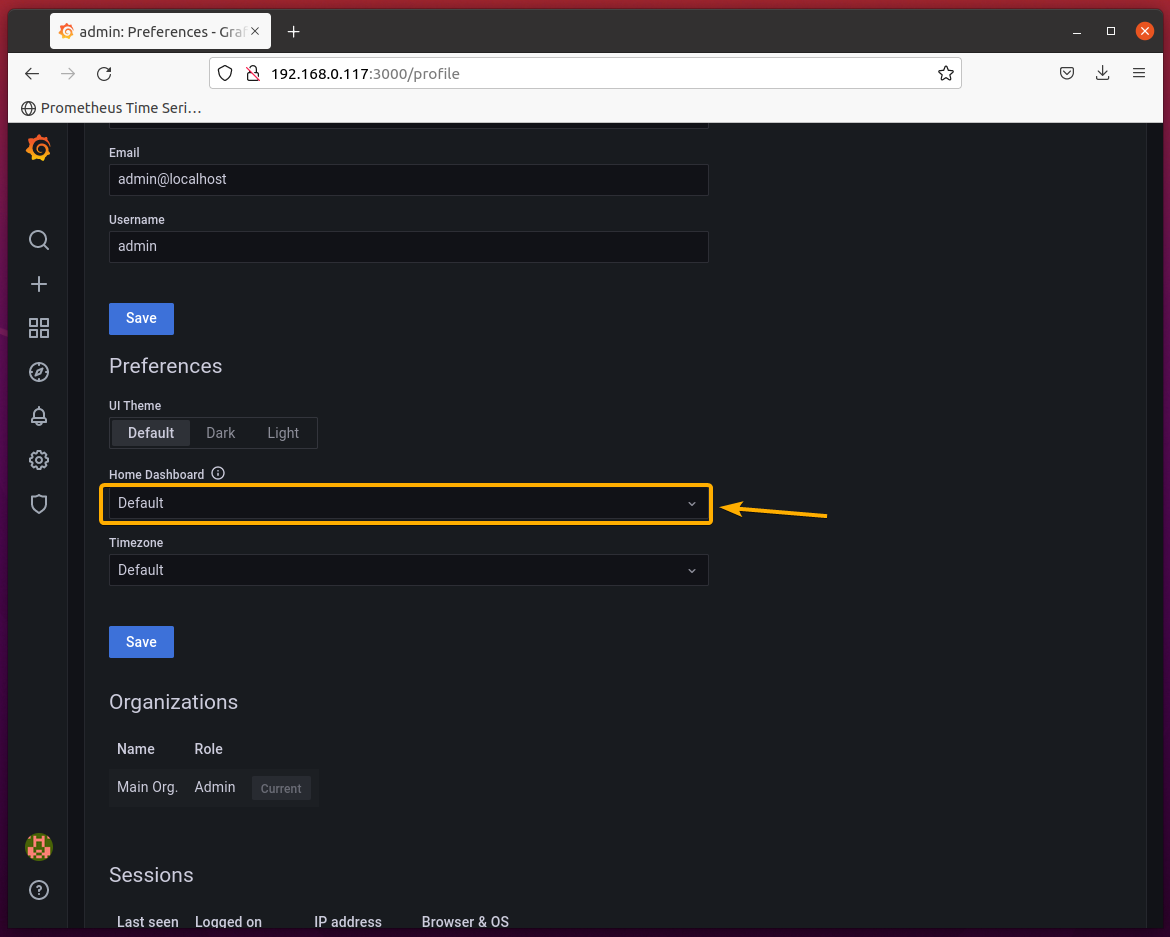
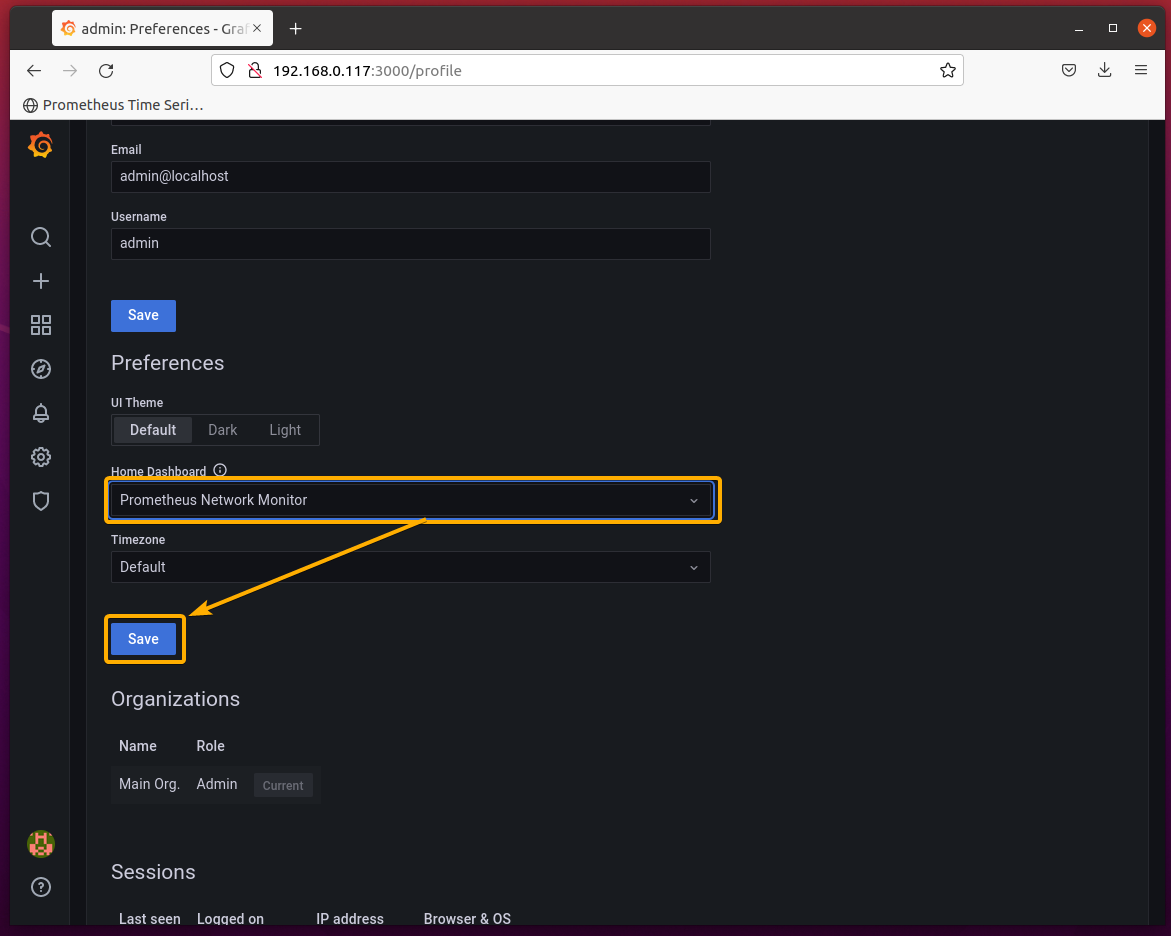
Click on the Home Dashboard dropdown menu as marked in the screenshot below.
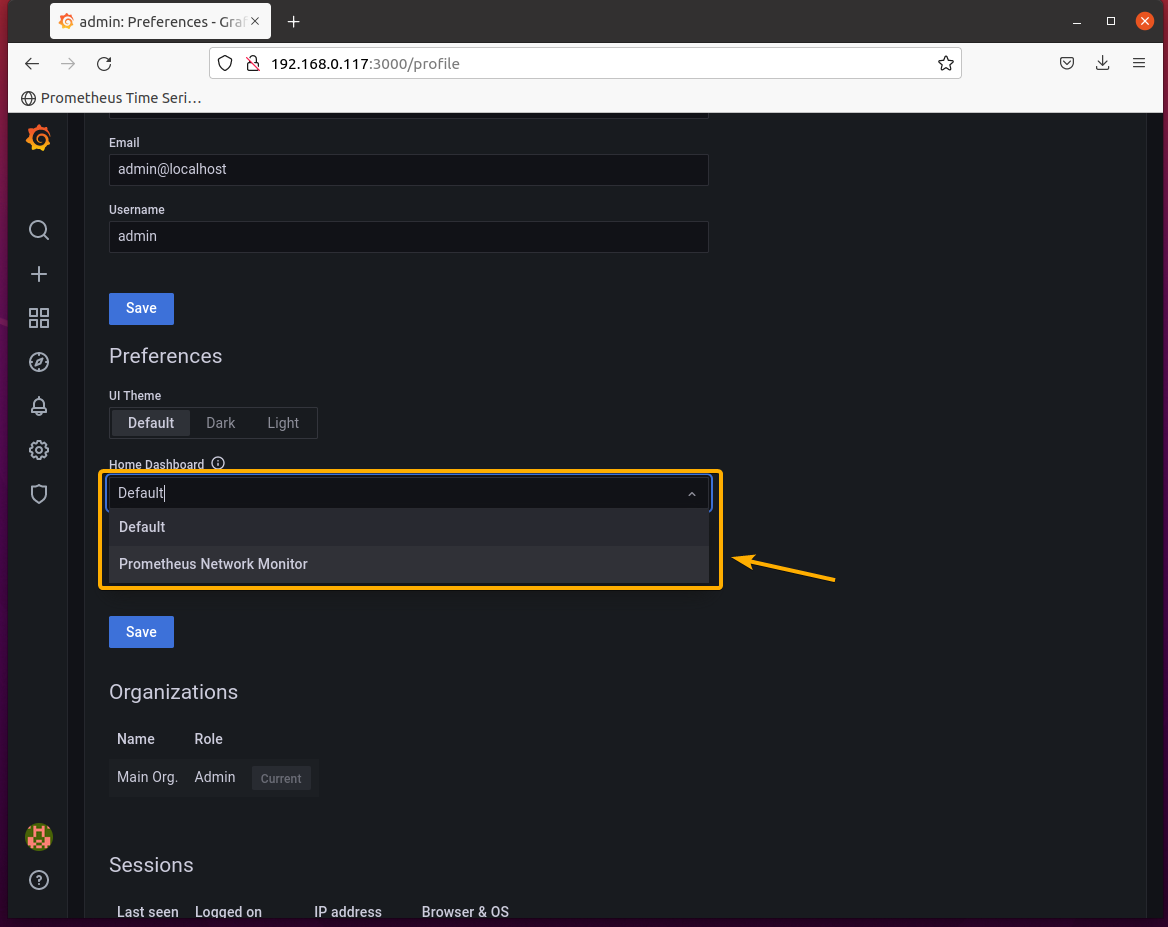
The starred Dashboard should be listed in the Home Dashboard dropdown menu, shown in the screenshot below. Select the Prometheus Network Monitor Dashboard from here.
Once you’re done, click on Save.
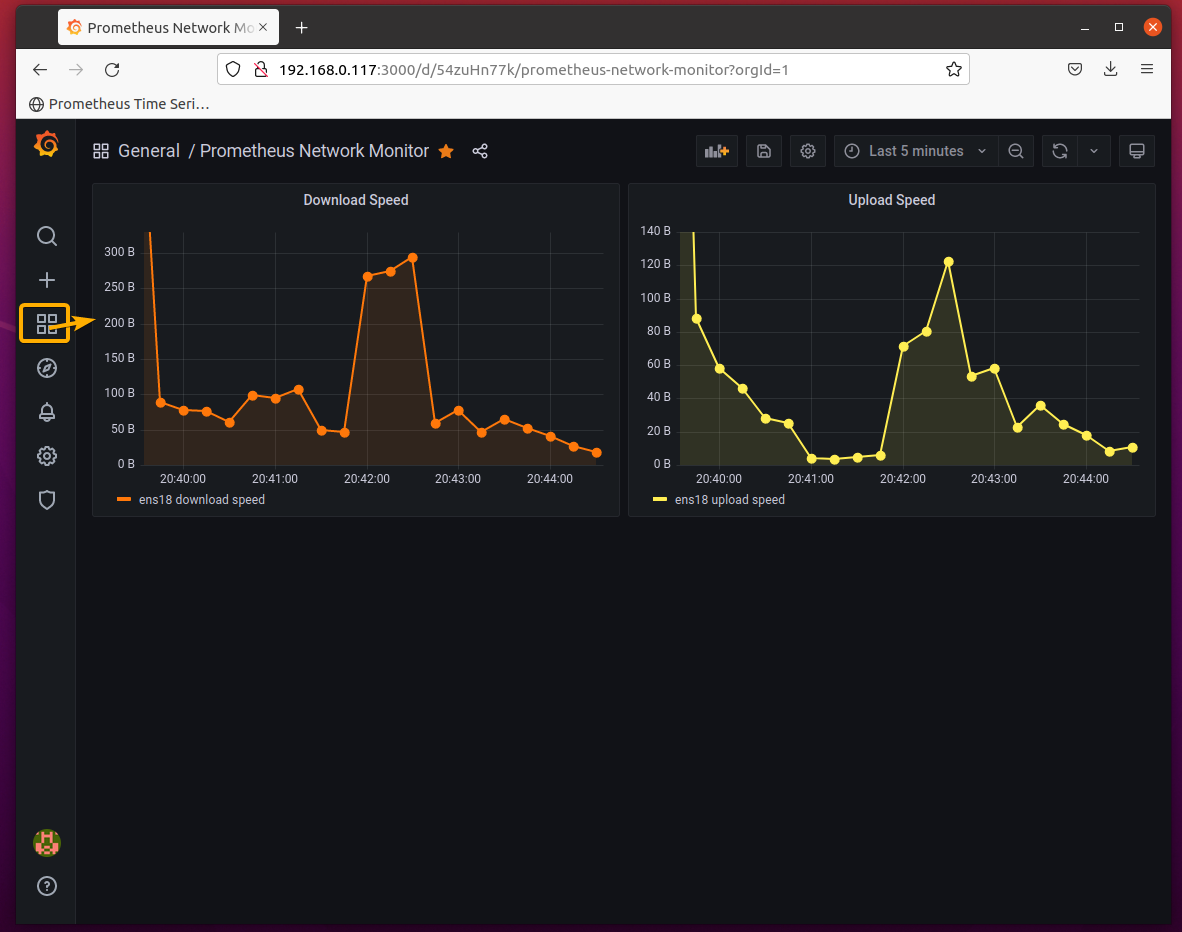
If you click on the Dashboard icon, the Prometheus Network Monitor Dashboard should be displayed by default, as you can see in the screenshot below.
Conclusion:
In this article, I have shown you how to install the latest version of Grafana on Ubuntu 20.04 LTS and connect Prometheus as a data source on Grafana. I have also shown you how to create a basic Grafana Dashboard and set it as a default Grafana Dashboard. This article should help you get started with Prometheus and Grafana.


