
RAM is very fast and it’s closer to the CPU (Central Processing Unit) of the computer. As RAM is closer to the CPU of the computer, the CPU has direct access to RAM. Thus, the data access latency is very small compared to storage devices such as HDD or SSD. That’s why all the programs use RAM for storing cache data.
Unfortunately, RAM is very expensive and limited. Without enough free RAM, your computer won’t function properly. The running programs of your computer may hang or stop. You may not be able to start any new programs. In the worst case, your entire system will hang and become unusable.
Checking RAM usage is one of the most important tasks in Linux. You can diagnose many Linux problems if you can monitor RAM usage of your Linux system.
There are many tools to check memory usage in Linux. In this article, I am going to show you some of the most common ways to check memory usage on Linux. So, let’s get started.
The Units of Computer Memory:
In this article, you will see me using the terms kilobytes, megabytes, gigabytes, kibibytes, mebibytes, gibibytes, and so on. Don’t be confused. I will explain them in this section.
All the computer storages use the same unit. This is very important to understand.
The computer storage units are given below.
- Bit: The smallest unit of computer storage is a bit. A bit can hold either a 0 or a 1. That’s it.
- Byte: 8 bits form a byte.
- Kilobyte: 1,000 bytes form a kilobyte.
- Megabyte: 1,000 kilobytes form a megabyte.
- Gigabyte: 1,000 megabytes form a gigabyte.
- Terabyte: 1,000 gigabytes form a terabyte.
- Petabyte: 1,000 terabytes form a petabyte.
- Kibibyte: 1,024 bytes form a kibibyte.
- Mebibyte: 1,024 kibibytes form a mebibyte.
- Gibibyte: 1,024 mebibytes form a gibibyte.
- Tebibyte: 1,024 gibibytes form a tebibyte.
- Pebibyte: 1,024 tebibytes form a pebibyte.
In terms of bytes, the computer storage units are as follows.
- Kilobyte: 1,000 bytes or 103 bytes.
- Megabyte: 1,000,000 bytes or 106 bytes.
- Gigabyte: 1,000,000,000 bytes or 109 bytes.
- Terabyte: 1,000,000,000,000 bytes or 1012 bytes.
- Petabyte: 1,000,000,000,000,000 bytes or 1015 bytes.
- Kibibyte: 1024 bytes or 210 bytes.
- Mebibyte: 1,048,576 bytes or 220 bytes.
- Gibibyte: 1,073,741,824 bytes or 230 bytes.
- Tebibyte: 1,099,511,627,776 bytes or 240 bytes.
- Pebibyte: 1,125,899,906,842,624 or 250 bytes.
Now that you know the computer storage units, you should be able to convert from one unit to another very easily.
Notice that kilobyte, megabyte, gigabyte, terabyte, and petabyte are powers of 10 bytes. But, kibibyte, mebibyte, gibibyte, tebibyte, and pebibyte are powers of 2 bytes. For us humans, it’s easy to calculate in powers of 10 (decimal numeral system) as we have 10 fingers. But, for computers, it’s easier to calculate in powers of 2 (binary numeral system). So, computers use powers of 2 to represent the amount of storage or memory.
The units have shorthand notations or symbols. You will see them very frequently while checking memory usage in Linux.
The shorthand notations or symbols are given below.
- Bytes: B
- Kilobyte: KB or kB
- Megabyte: MB
- Gigabyte: GB
- Terabyte: TB
- Petabyte: PB
- Bytes: B
- Kibibyte: KiB or K
- Mebibyte: MiB or M
- Gibibyte: GiB or G
- Tebibyte: TiB or T
- Pebibyte: PiB or P
Some programs may not follow this standard and use these shorthands or symbols interchangeably. The difference is not that much between these units (i.e. kilobyte vs kibibyte) anyway. Don’t worry about it.
Memory vs Swap in Linux:
In Linux, the physical memory is called memory. When the physical memory fills up, Linux intelligently moves the less frequently accessed data from the memory to a specific part of the disk (HDD or SSD). This part of the disk is called swap.
When there is no available free physical memory, some less frequently access data is moved to the swap. This frees up the physical memory and thus saves the system from crashing.
Swap disk is very slow compared to RAM or physical memory. If a Linux system uses swap space extensively, the system may become very slow and unresponsive. So, a Linux system shouldn’t use the swap space. We want to avoid it as much as possible. When a Linux system starts to fill up the swap space, it is a sign that the Linux system needs more physical memory. It’s a good idea to add more RAM or physical memory to the system.
Checking Memory Usage with free:
free is a command that displays the total memory usage information of the system. free is shipped with almost all the Linux distribution by default.
You can check memory usage with the free command as follows:
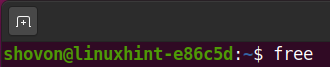
The free command without any command-line options displays the memory and swap usage information in the Kibibytes unit.

By default, the free command shows the buffers and cache memory usage in the buff/cache column. If you want to see the buffers and cache memory separately, then run the free command with the -w option as follows:
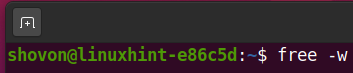
As you can see, the buffers and cache memory usage information is shown in different columns.

The free command shows the following information:
total: This is the total available physical memory and swap space (in kibibytes) of your Linux system.
used: This is the amount of physical memory and swap space that is used by your Linux system. Notice that 0 KiB of swap space is used in my Ubuntu machine. So, it’s not using swap at all. That’s very good.
free: This is the amount of physical memory that is still unused.
shared: This is the amount of memory that is shared by different processes or programs. One or more Linux programs may use the same library or function calls. Instead of allocating memory multiple times for the same things, Linux intelligently shares the common stuff among these processes or programs. This saves physical memory. The tmpfs filesystems ( i.e. /dev/shm, /run, /run/lock, /run/user/<user-id>, /sys/fs/cgroup etc.) also use some physical memory which is shared to every processes and programs in Linux.
buffers: This is the amount of memory that is used by kernel buffers. A buffer is a block of memory where data is kept temporarily while moving data from one place to another.
cache: This is the amount of physical memory that is used for cache data.
buff/cache: This is the total amount of physical memory used for buffers and cache.
available: This is the estimated available physical memory that can be used for starting new applications without swapping.
You can also use various command-line options to see the memory and swap usage information in different units.
For example, to see the memory and swap usage information in bytes, run the free command with the -b or –bytes option as follows:

To see the memory and swap usage information in kibibytes (default), run the free command with the -k or –kibi option as follows:

To see the memory and swap usage information in mebibytes, run the free command with the -m or –mebi option as follows:

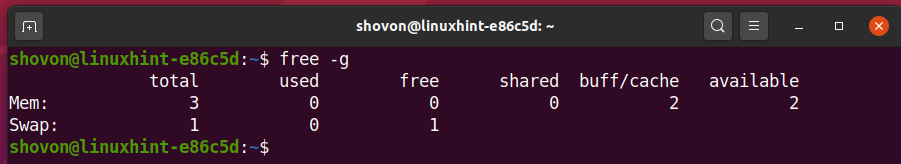
To see the memory and swap usage information in gibibytes, run the free command with the -g or –gibi option as follows:
In the same way, you can use the –tebi and –pebi command-line options to display the memory and swap usage information in tebibytes and pebibytes respectively.
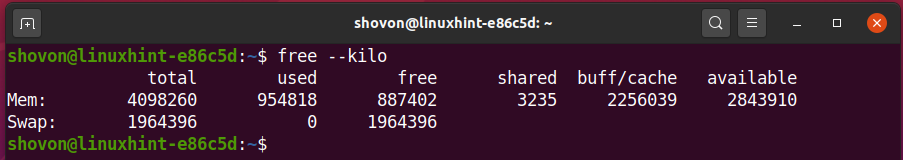
If you want to display the memory and swap usage information in kilobytes, then run the free command with the –kilo option as follows:
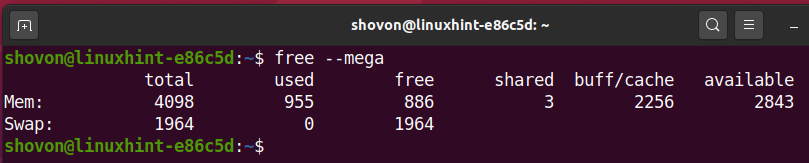
If you want to display the memory and swap usage information in megabytes, then run the free command with the –mega option as follows:
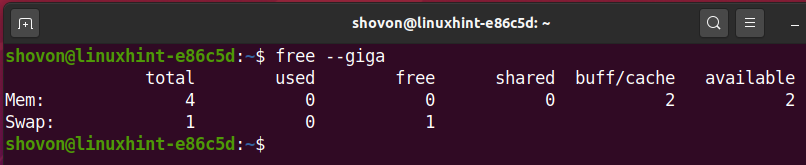
If you want to display the memory and swap usage information in gigabytes, then run the free command with the –giga option as follows:
In the same way, you can use the –tera and –peta command-line options to display the memory and swap usage information in terabytes and petabytes respectively.
The free command also has a human-readable output option. This option will print a very easy to understand (for humans) memory and swap usage information on the screen.
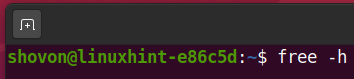
For human-readable output, run the free command with the -h or –human option as follows:
As you can see, the human-readable format is really easy to understand.
The -h or –human option prints the memory and swap usage information in either bytes, kibibytes, mebibytes, gibibytes, tebibytes, or pebibytes by default. These units use the base-2 or the binary numerical system (powers of 2).

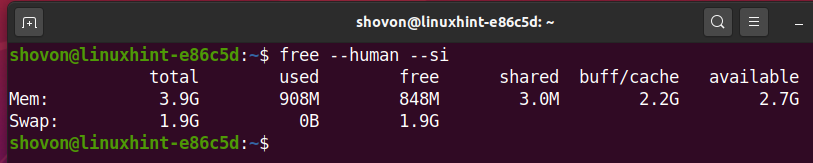
If you want to see the human-readable output in base-10 or decimal numerical system (powers of 10), then run the free command with -h or –human command-line option as well as –si command-line option as follows:

The free command will print the memory and swap usage information in either bytes, kilobytes, megabytes, gigabytes, terabytes, or petabytes. These units use the base-10 or the decimal numerical system (powers of 10).
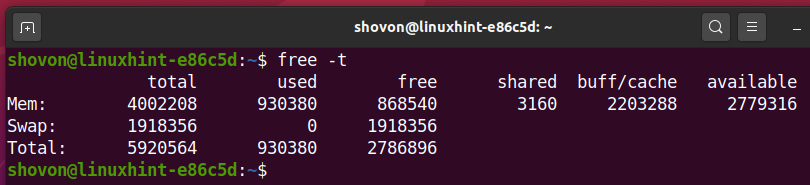
If you want to display the total memory and swap usage information, run the free command with the -t or –total option as follows:
As you can see, the total memory (physical + swap) usage information is displayed at the end of the output.
You can also run the free command in monitoring mode. In this mode, the free command will continuously print the memory and swap usage information after a given interval of time (in seconds).
You can run the free command in monitoring mode with the -s or –seconds command-line option as follows:
Or,
Here, <delay> is the number of seconds after which new memory and swap usage information will be printed on the screen.
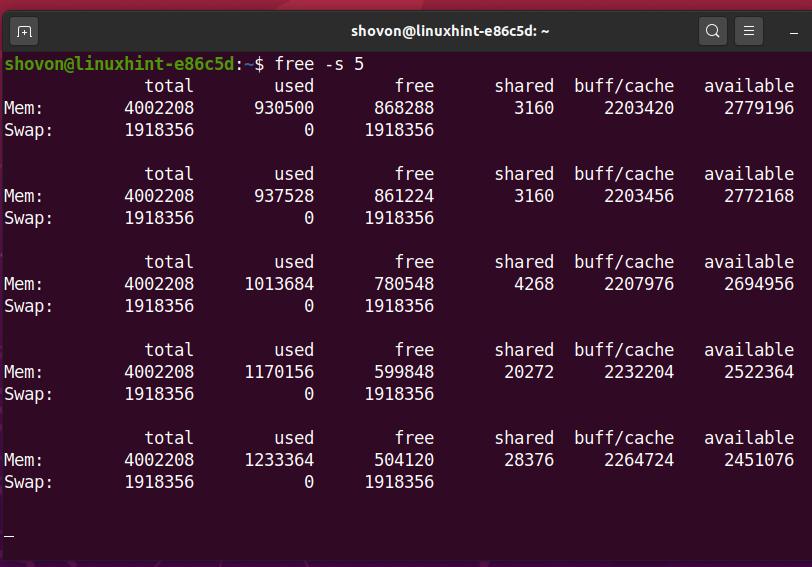
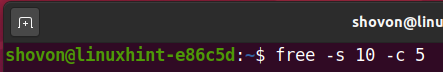
For example, to print memory and swap usage information continuously at 5 seconds interval, run the free command as follows:
As you can see, the memory and swap usage information is being printed every 5 seconds.
If you want to stop the free command, press <Ctrl> + C.
In the monitoring mode, the free command will continuously print memory and swap usage information by default. You can use the -c or –count command-line option to limit the number of times new memory and swap usage information is printed on the screen.
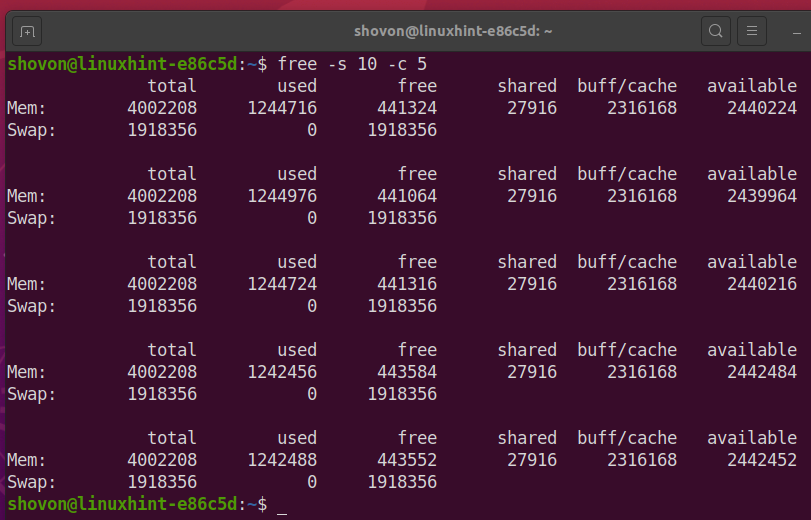
For example, to print the memory and swap usage information 5 times at 10 seconds interval, run the free command as follows:
As you can see, the free command printed the memory and swap usage information only 5 times at 10 seconds interval.
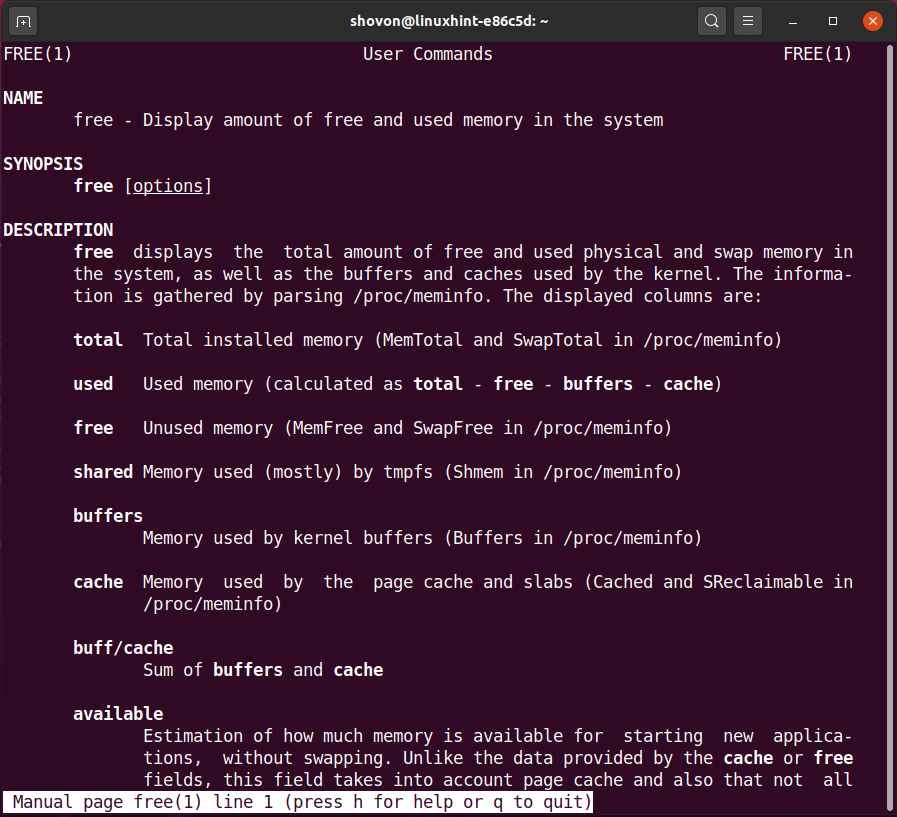
That’s almost all you need to know to check memory and swap usage with the free command. But, if you want to know more, check the manpage of the free command as follows:
The manpage of the free command should be displayed.
Checking Memory Usage by Reading /proc/meminfo File:
You can also check the memory usage information of your Linux system by reading the /proc/meminfo file.
You can read the /proc/meminfo file with the following command:

The file has a lot of memory usage information. The memory usages are in the kibibytes unit.
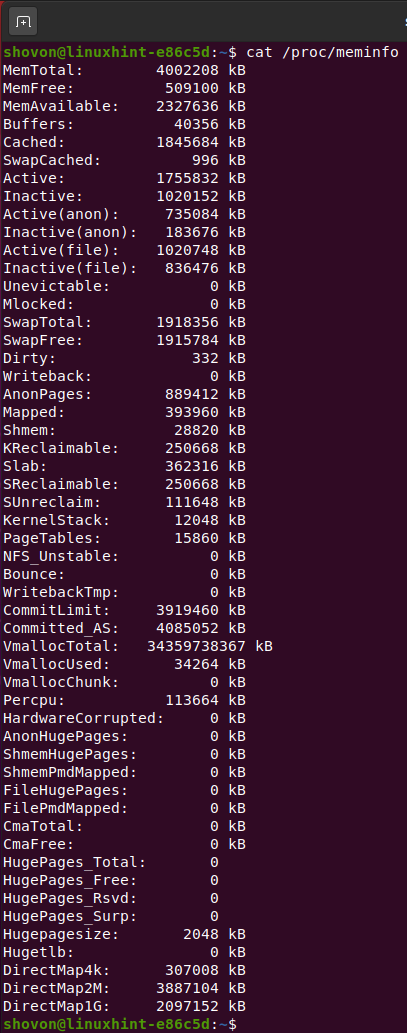
The most important memory usage information in the /proc/meminfo file are:
MemTotal: This is the total installed memory or physical memory (RAM) of the Linux system.
MemFree: This is the amount of unused physical memory (RAM).
MemAvailable: This is the estimated amount of physical memory (RAM) available for new programs.
Buffers: This is the amount of physical memory that is reserved for kernel buffers. Buffers are used to temporarily store data while moving it from one location to another.
Cached: This is the amount of physical memory used as cache memory.
SwapCached: This is the amount of memory that was moved to the swap disk and moved back into the physical RAM. But the data is still cached in the swap disk.
Active: This is the amount of physical memory that is being used and usually not reclaimable unless necessary.
Inactive: This is the amount of physical memory that is being used and easily reclaimable by other processes or programs if necessary.
Active(anon): This is the amount of physical memory used by the anonymous tmpfs file systems and shared memory.
Inactive(anon): This is the amount of physical memory used by the anonymous tmfs file systems and shared memory that is reclaimable.
Active(file): This is the amount of cache memory that is actively used.
Inactive(file): This is the amount of cache memory that is newly loaded or is reclaimable.
Unevictable: This is the amount of memory that can’t be reclaimed as it is locked by user programs.
Mlocked: This is the total amount of memory that can’t be reclaimed as it is locked by user programs.
SwapTotal: This is the total size of the swap disk.
SwapFree: This is the amount of swap space that is free.
Dirty: The total amount of memory that is waiting to be written back to the disk.
Writeback: The total amount of memory that is being written back to the disk.
AnonPages: The total amount of memory used by pages and are mapped into userspace page tables.
Mapped: The amount of memory that is used for files that have been mmaped by the Linux kernel such as the libraries used by different programs.
Shmem: This is the amount of memory that is shared and used by the tmpfs filesystems.
KReclaimable: The amount of memory that is claimed by the kernel and can be reclaimed when necessary.
Slab: This is the amount of memory that is used by the kernel to cache data structures for the use of the kernel.
SReclaimable: This is the amount of memory from the Slab that can be reclaimed.
SUnreclaim: This is the amount of memory from the Slab that cannot be reclaimed even when necessary.
KernelStack: This is the amount of memory that is used for the kernel stack allocation.
PageTables: This is the amount of memory that is dedicated to page tables. A page table is a data structure used by a computer to map between virtual memory and physical memory.
Bounce: This is the amount of memory used for the buffer of block devices (i.e. storage devices such as HDD or SSD).
WritebackTmp: The amount of memory that is used for the FUSE temporary writeback buffers.
There is many other memory usage information in the /proc/meminfo file. If you’re interested, you can take a look at what they are in the manpage of proc.
To open the manpage of proc, run the following command:
The manpage of proc should be opened.
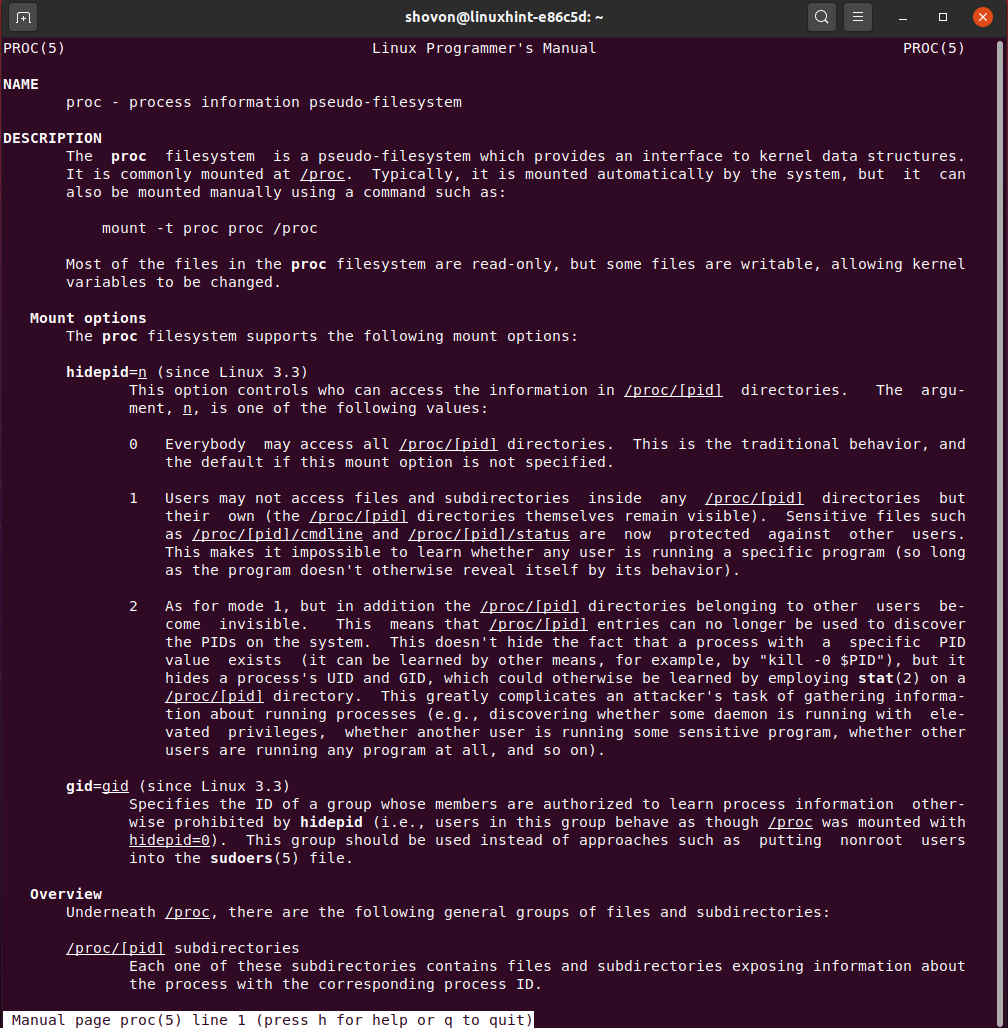
Type in /proc/meminfo and press <Enter>. It should navigate you to the /proc/meminfo section as you can see in the screenshot below. You will find descriptions of every field in the /proc/meminfo file here.

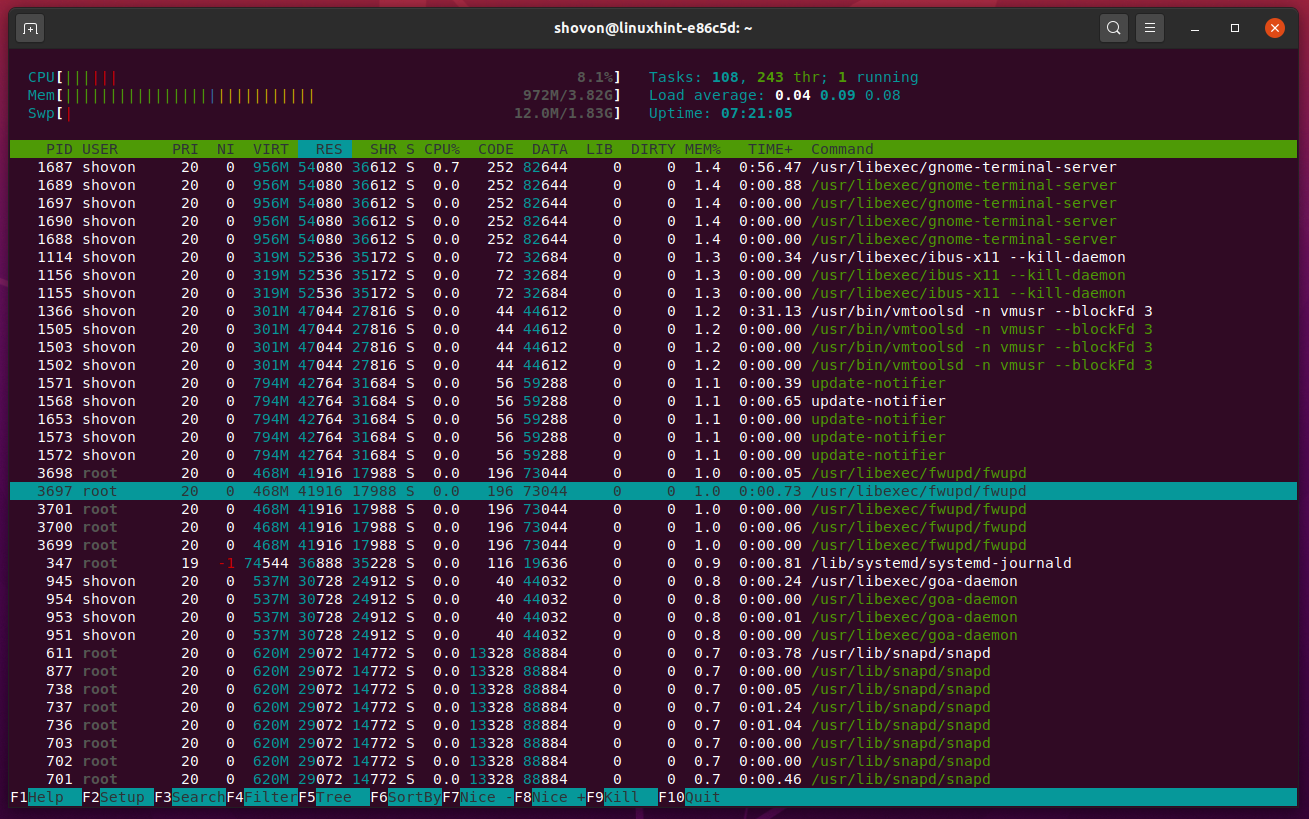
Checking Memory Usage using top:
The top is a program that displays the running processes and their resource usage in real-time. The top comes preinstalled in most Linux distributions.
You can run top with the following command:
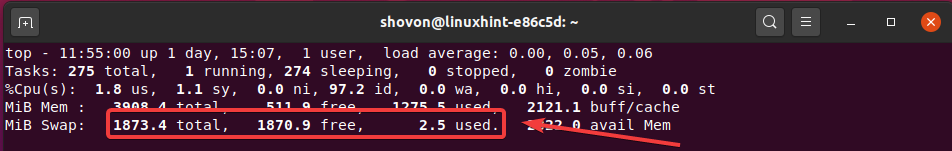
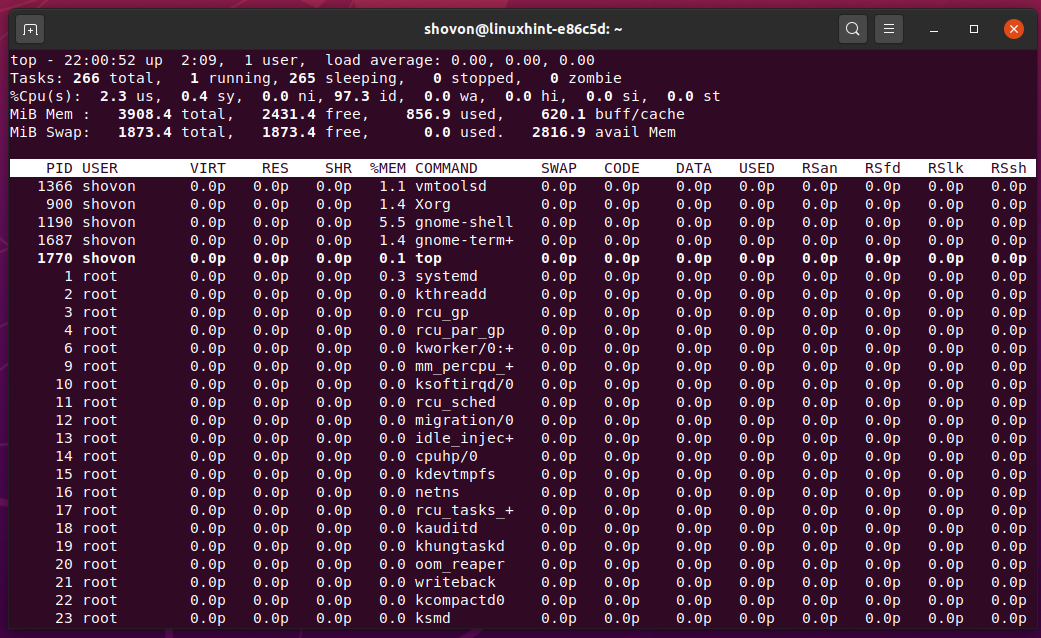
The top program should start. On the top section of the top program as marked in the screenshot below, you should see the memory and swap usage summary in the mebibytes unit (default).

The top command will show the following physical memory information:
total: The total available physical memory of the system.
free: The amount of physical memory still unused.
used: The amount of physical memory used by the system.
buff/cache: The amount of physical memory used as cache memory and buffer.
avail Mem: The amount of physical memory that is available for new programs.

The top command will show the following swap information:
total: The total available swap memory of the system.
free: The amount of free swap memory of the system.
used: The amount of swap memory used by the system.
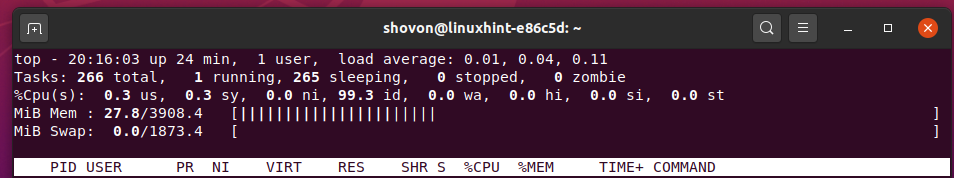
You can press m to change between different memory usage summary mode.
For example, pressing m once will switch to the following mode. In this mode, the top shows the physical memory and swap usage information as percent_memory_used/total_memory_in_mebibytes.
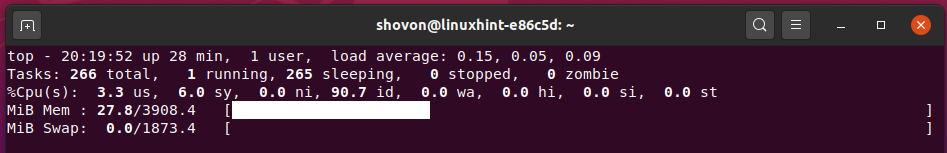
Pressing m again will change the progress bar style. The information will be the same as before.
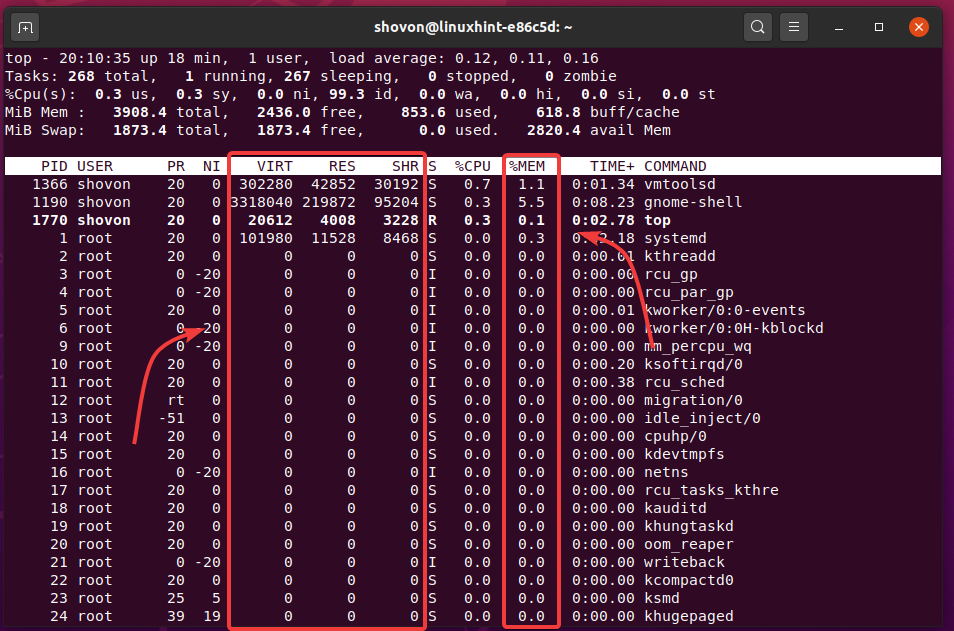
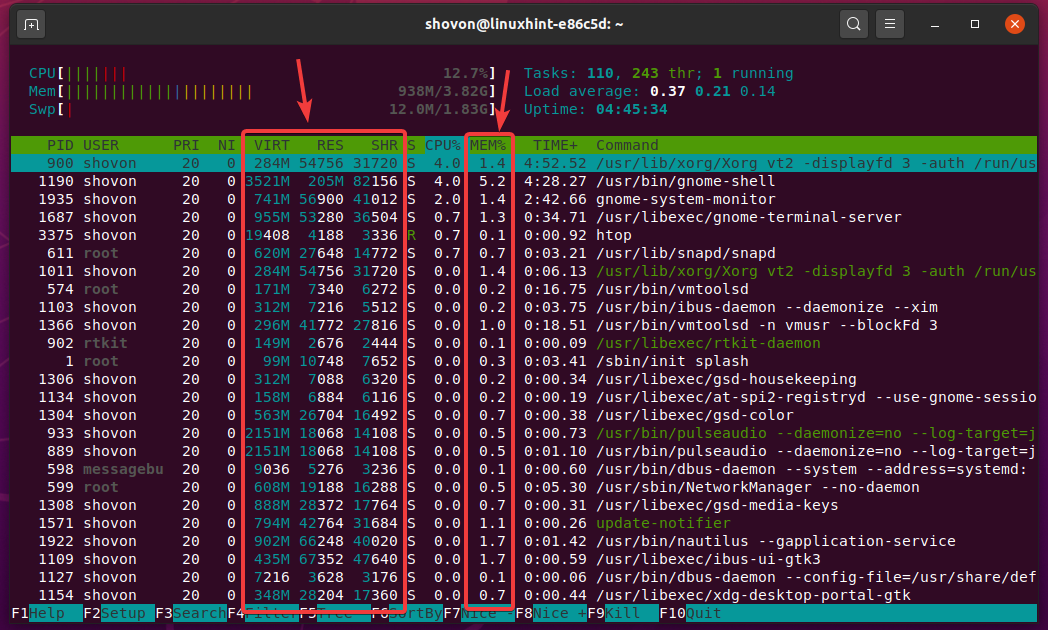
The top command also shows memory usage information for each of the processes running on your computer in real-time. The top command displays memory usage information of processes in the kibibytes unit by default.
By default, the top command shows the following memory usage information:
VIRT: This is the Virtual Memory Size of the process. Virtual memory is the total physical and swap memory used by the process.
RES: This is the Resident Memory Size of the process. The resident memory is the amount of physical memory the process is using.
SHR: This is the Shared Memory Size of the process. This is the amount of memory that the process is using that is also shared with some other processes.
%MEM: The percentage of the physical memory the process is using.
You can configure the top command to show more memory usage information such as,
CODE: This is the Code Size of the process. It is the amount of physical memory dedicated to the executable code of the process. It is also known as Text Resident Set or TRS.
DATA: This is the Data and Stack Size of the process. It is the amount of memory reserved by a process. It may not be mapped to physical memory yet. But it will always show up in the virtual memory (VIRT) of the process. It is also known as Data Resident Set or DRS.
RSan: This is the Resident Anonymous Memory Size of the process. It is a subset of the physical memory (RES) which represents private pages that are not yet mapped to a file.
RSfd: This is the Resident File-Backed Memory Size of the process. It is a subset of the physical memory (RES) which represents shared pages and supporting program images, shared libraries, file mappings, etc.
RSsh: This is the Resident Shared Memory Size of the process. It is a subset of the physical memory (RES) which represents shared anonymous pages.
RSlk: This is the Resident Locked Memory Size of the process. It is the amount of physical memory (RES) that can’t be swapped out. It must remain in physical memory.
SWAP: This is the Swapped Size of the process. It is the amount of physical memory (RES) information that is moved to the swap disk space from the physical memory.
USED: This is the total amount of memory (physical + swap) the process is using.
Note that the physical memory (RES) used by a process is the summation of Resident Anonymous Memory Size (RSan), Resident File-Backed Memory Size (RSfd), and Resident Shared Memory Size (RSsh).
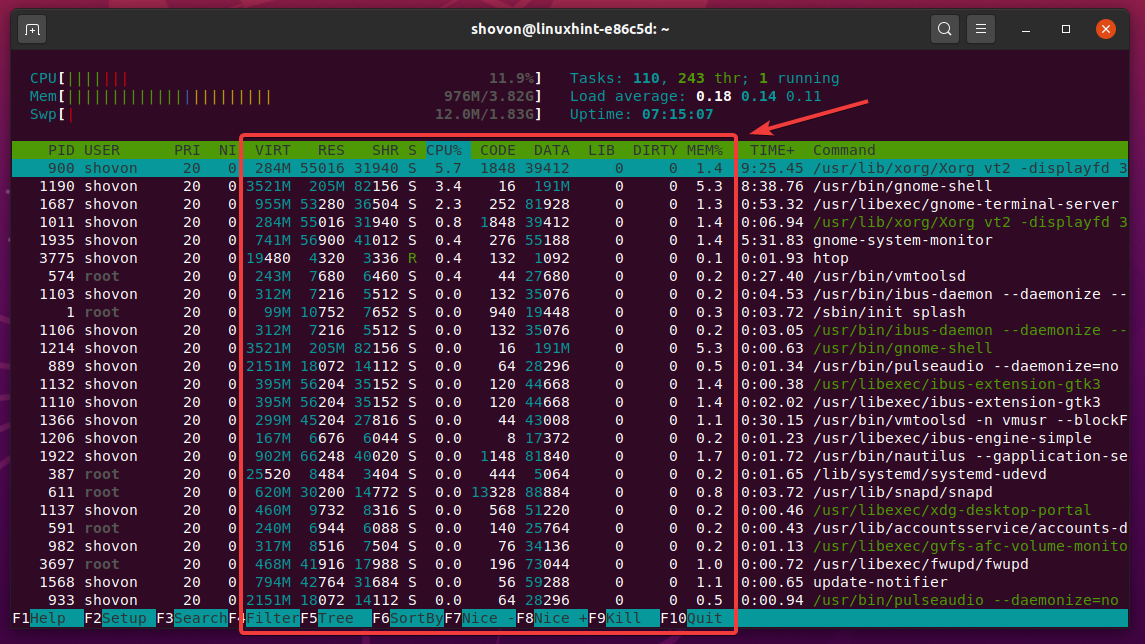
To enable these memory information columns, run top and press f.
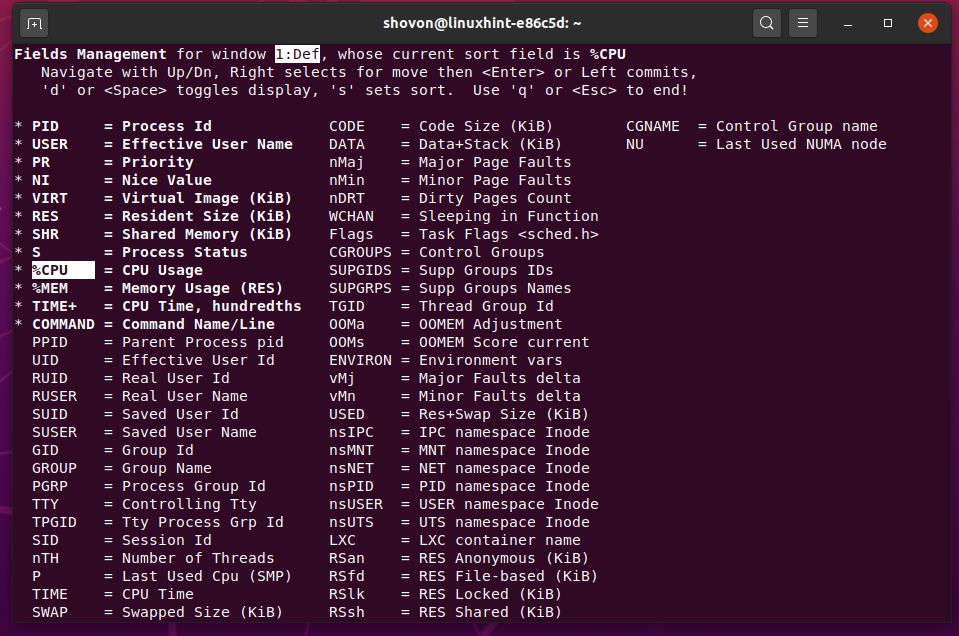
Use the arrow keys to navigate to the marked columns and press the <Space Bar> to toggle it. The enabled columns will have a * mark on the left.
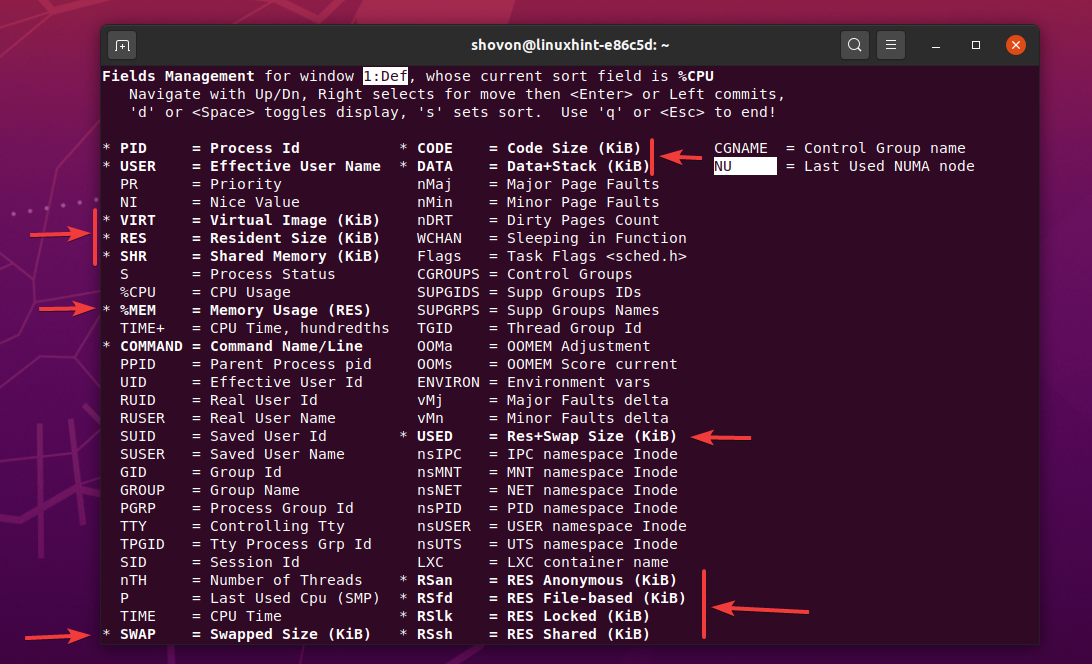
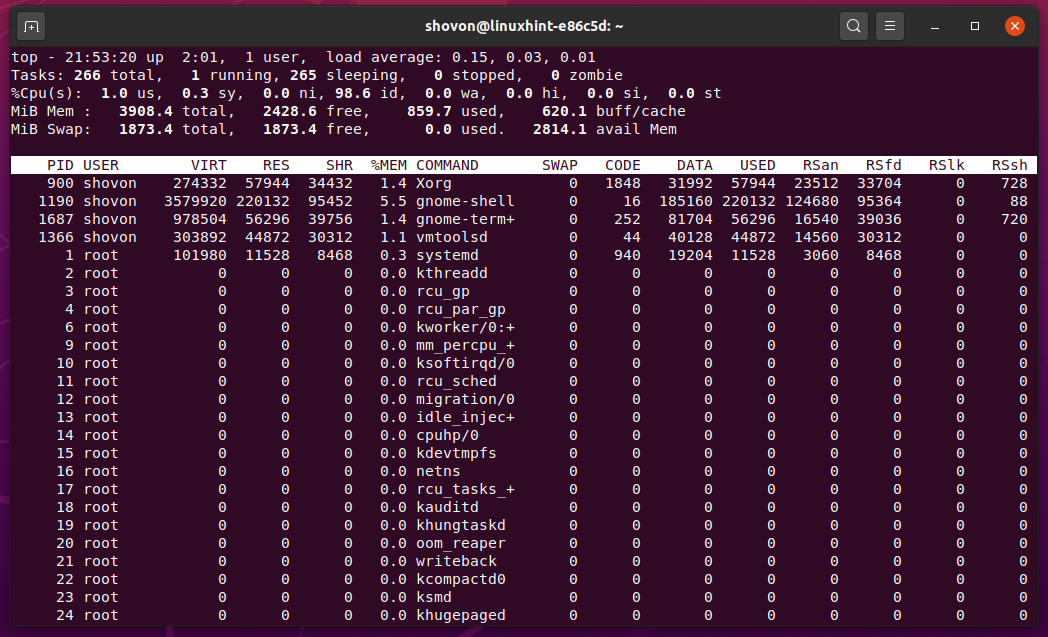
Once you’re done, press q to go back to the top process monitoring window. As you can see, the memory usage information columns SWAP, CODE, DATA, USED, RSan, RSfd, RSlk, RSsh are displayed.
By default, the top command shows memory usage information in the kibibyte unit. If you want to see the memory usage information in a different unit like mebibyte, gibibyte, tebibyte, or pebibyte, you can do that as well.
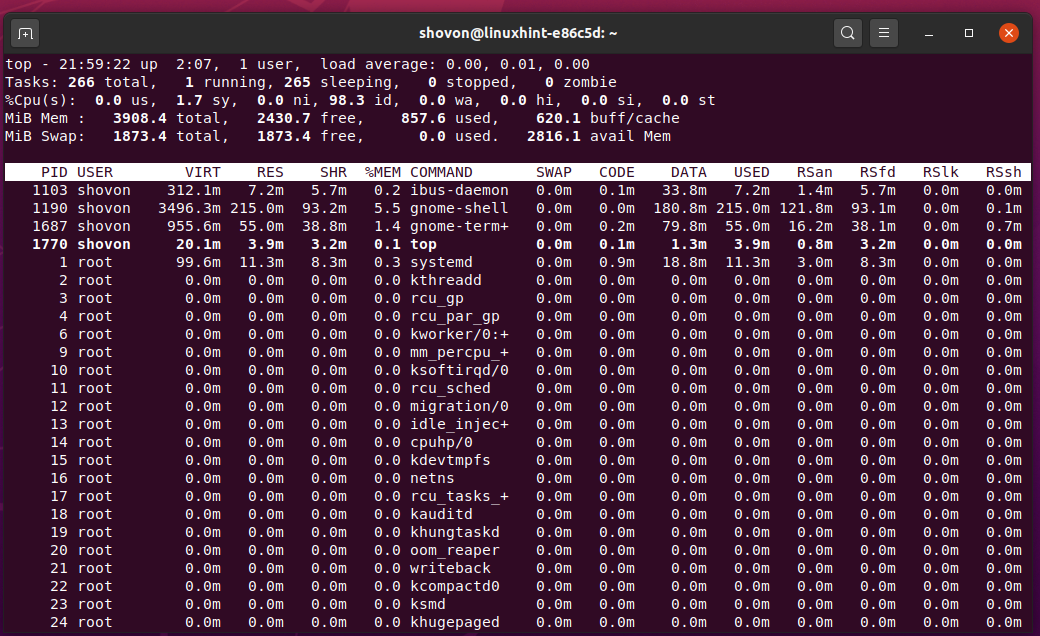
To toggle between different memory units (kibibyte, mebibyte, gibibyte, tebibyte, or pebibyte), run top and press e.
top memory usage information is being displayed in mebibytes.
top memory usage information is being displayed in gibibytes.

top memory usage information is being displayed in tebibytes.

top memory usage information is being displayed in pebibytes.
A lot of processes run on your Linux operating system. The top command can’t show them all at once. You can press and hold the <Up> and <Down> arrow keys to navigate the list of processes the top command displays.
You can also sort the output of the top command by a specific column.
Let’s say, you want to see which process is using the most amount of swap space. To do that, run top and press f.
Then, select the SWAP column using the arrow keys of your keyboard and press s.

The sort field of the top command should be changed to SWAP. Press q to go back to the process monitoring window.
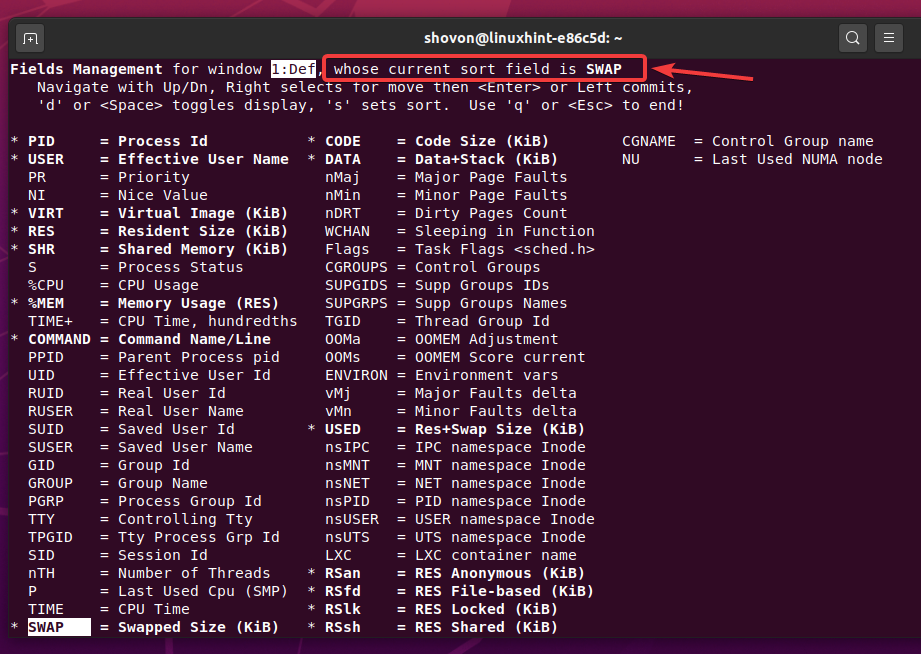
As you can see, the processes that are using the most swap space are listed first.

Once you’ve configured the top command, you can press <Shift> + w to save the configuration to a toprc configuration file. This way, you don’t have to reconfigure the top every time you use it.

Checking Memory Usage using htop:
htop is a Linux real-time process viewer just like the top. But the htop has additional features that top does not. The most obvious new feature of htop is syntax highlighting and better user interface. You can say htop is an extended top.
Like the top, htop is not preinstalled on most of the Linux distribution. But it is available in the official package repository of almost all the Linux distributions out there. So, you can easily install it on your desired Linux distribution.
To install htop on Ubuntu/Debian, run the following commands:
$ sudo apt install htop -y
NOTE: On CentOS/RHEL, htop is available in the EPEL repository. Before you install the htop, you must have an EPEL repository (epel-release package) installed on your CentOS/RHEL system.
To install htop on CentOS 7/RHEL 7, run the following commands:
$ sudo yum install htop -y
To install htop on CentOS 8/RHEL 8, run the following commands:
$ sudo dnf install htop -y
Once htop is installed, you can run it with the following command:
Htop should start.
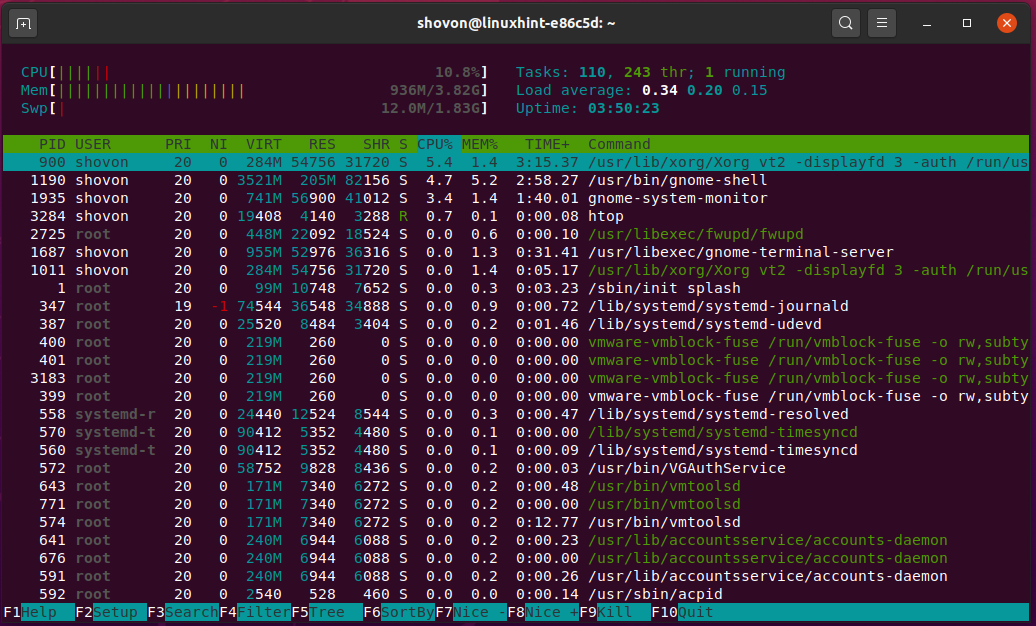
On the top, htop displays physical memory and swap usage summary. It also shows the memory and swap usage in a nice bar graph.
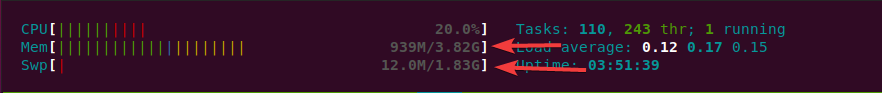
The memory and swap usage information is in the format used/total. htop will automatically decide the unit (kibibyte, mebibyte, gibibyte, tebibyte, or pebibyte) to best describe the memory and swap usage information.

The memory and swap usage bars are represented by different colors. The colors have meanings.

To know what each color represents, run htop and press h to go to the help window of htop.
As you can see, the green color represents physical memory that is used by different programs/processes, the blue color represents the physical memory used as buffers, the yellow color represents the physical memory used as cache memory, and the red color represents the used swap space.
To go back to the main htop window, press q.

Like the top, the htop program also shows memory usage information of each of the processes running on your Linux system. htop will automatically decide the unit (kibibyte, mebibyte, gibibyte, tebibyte, or pebibyte) to best describe the memory usage of each of the processes.
By default, the htop command shows the following memory usage information:
VIRT/M_SIZE: This is the size of the virtual memory of the process. Virtual memory is the total physical and swap memory used by the process.
RES/M_RESIDENT: This is the resident set size of the process. The resident memory is the amount of physical memory the process is using. It is equal to text + data + stack or M_TRS + M_DRS.
SHR/M_SHARE: This is the shared memory size of the process. This is the amount of memory the process is using that is also shared with some other processes.
%MEM/PERCENT_MEM: The percentage of the physical memory the process is using.
You can configure the htop command to show more memory usage information such as,
CODE/M_TRS: This is the code size of the process. It is the amount of physical memory dedicated to the executable code of the process.
DATA/M_DRS: This is the data and stack size of the process. It is the amount of memory reserved by a process. It may not be mapped to physical memory yet. But it will always show up in the virtual memory (VIRT/M_SIZE) of the process.
LIB/M_LRS: This is the library size of the process. It is the amount of physical memory a library code (used by the process/program) is using.
DIRTY/M_DT: This is the size of the dirty pages of the process. The section/page which is modified in the buffer is called a dirty page.
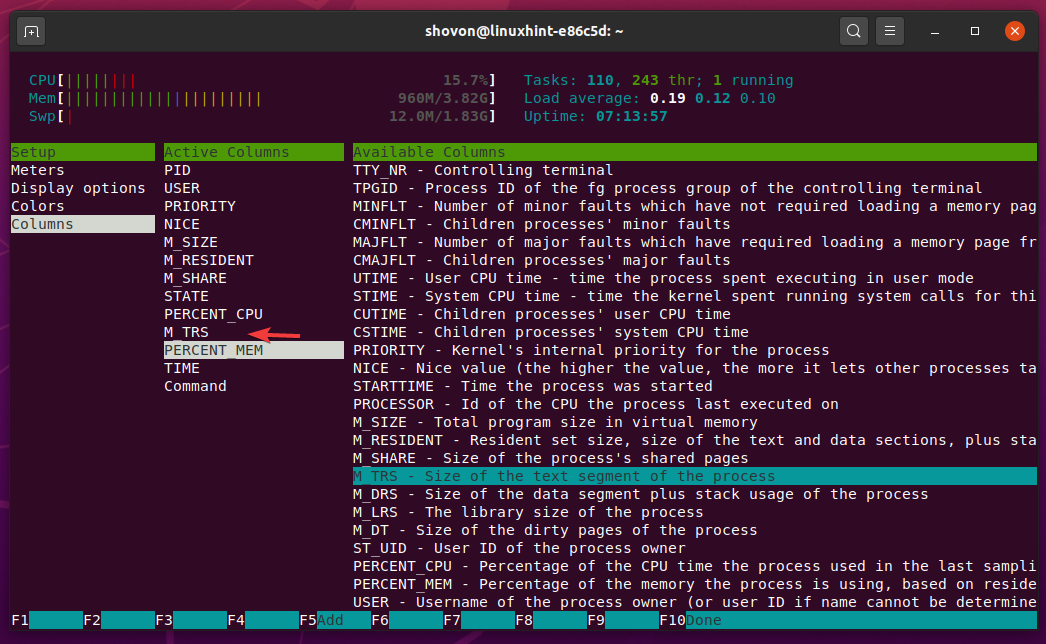
To enable these memory information columns, run htop and press F2.
Then, navigate to Columns from the Setup section, select the column before which you want to add new columns from the Active Columns section, select the column you want to add from the Available Columns section, and press <Enter> to add the column.

The column should be added to the Active Columns section.
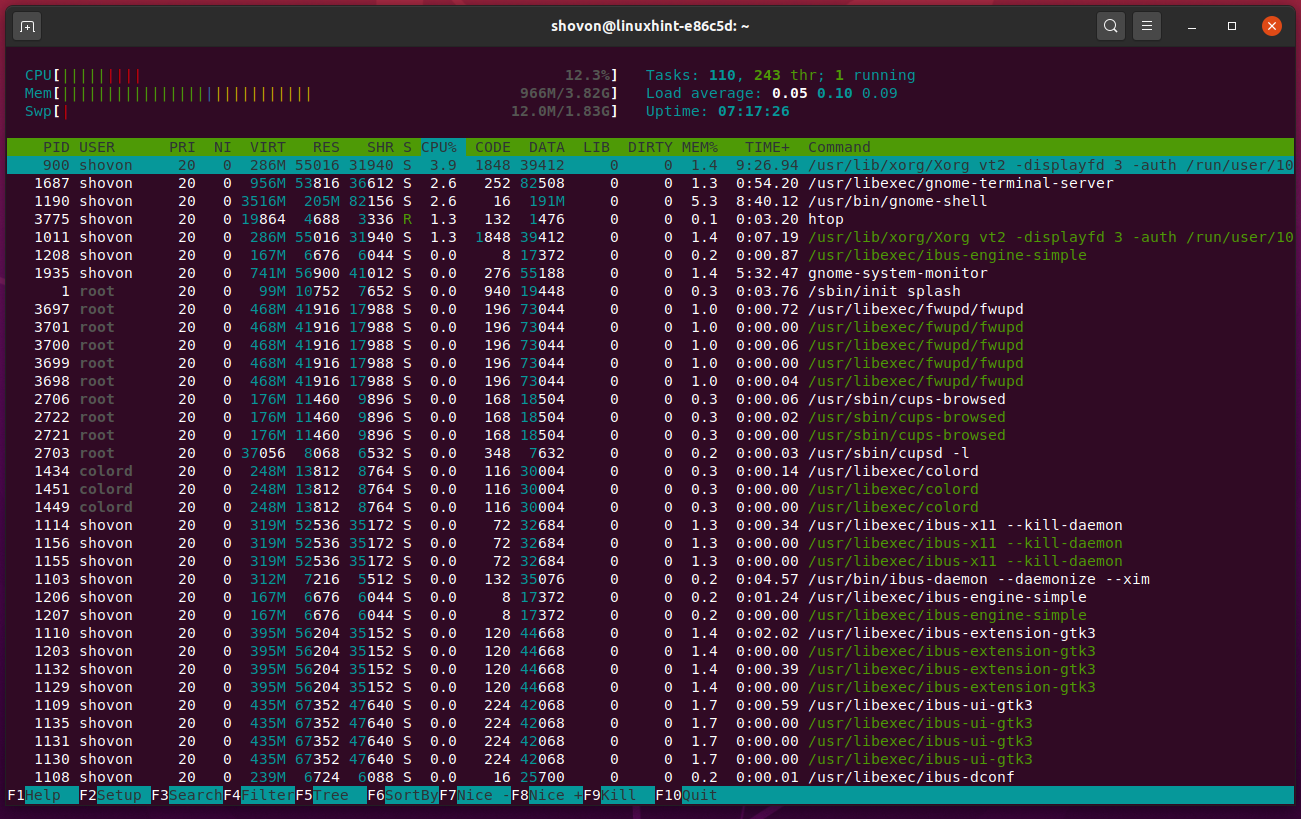
In the same way, add the other memory columns (columns that start with M_). Once you’re done, press <Esc> to go back to the main htop window.
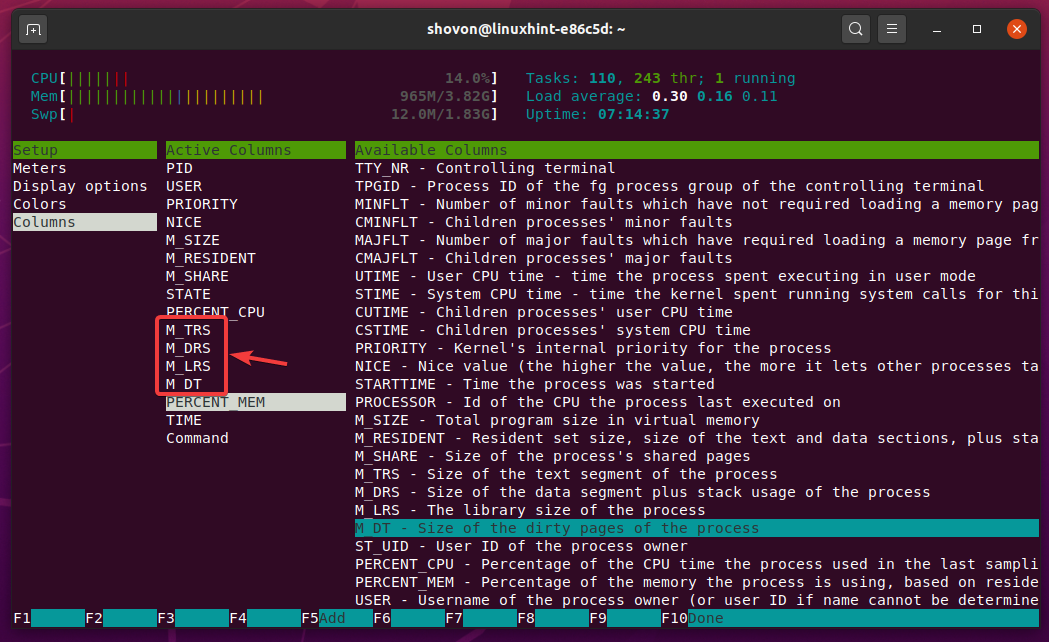
As you can see, the additional memory usage information columns are added.
You can view the processes in the tree view. In this view, the processes are organized by the parent-child relationship.
To switch to tree view, press t. As you can see, the processes are organized very nicely by their parent-child relationship. In this mode, you can see which child processes are spawned by a parent process and their memory usage.
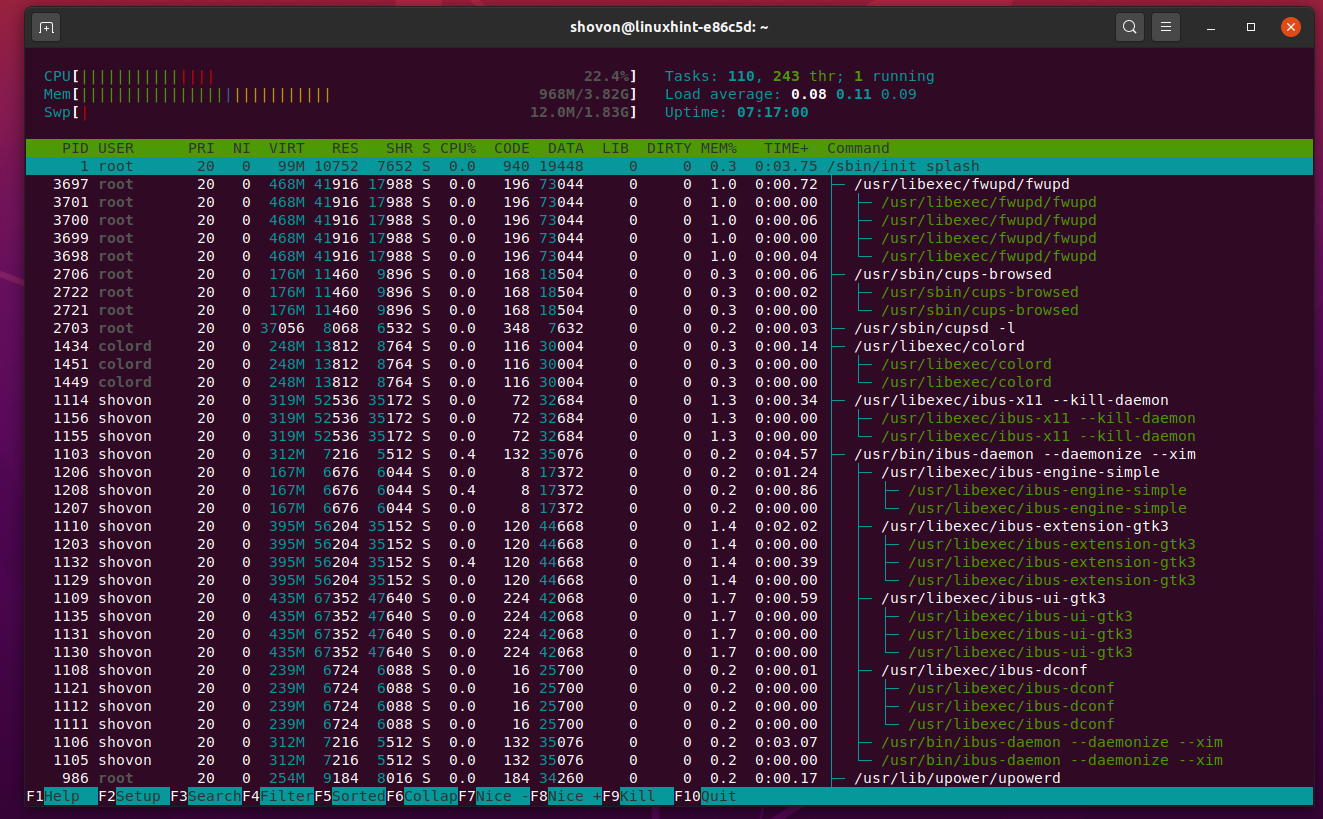
To exit the tree view, press t again. You should be back to the default view.
You can also sort the processes by different memory usage columns. By default, the processes are sorted by CPU usage (CPU%).
To sort the processes by a specific column, press F6.

Then, select a column which you want to sort the processes by from the Sort by section and press <Enter>.
I will sort the processes by M_RESIDENT/RES column for demonstration.
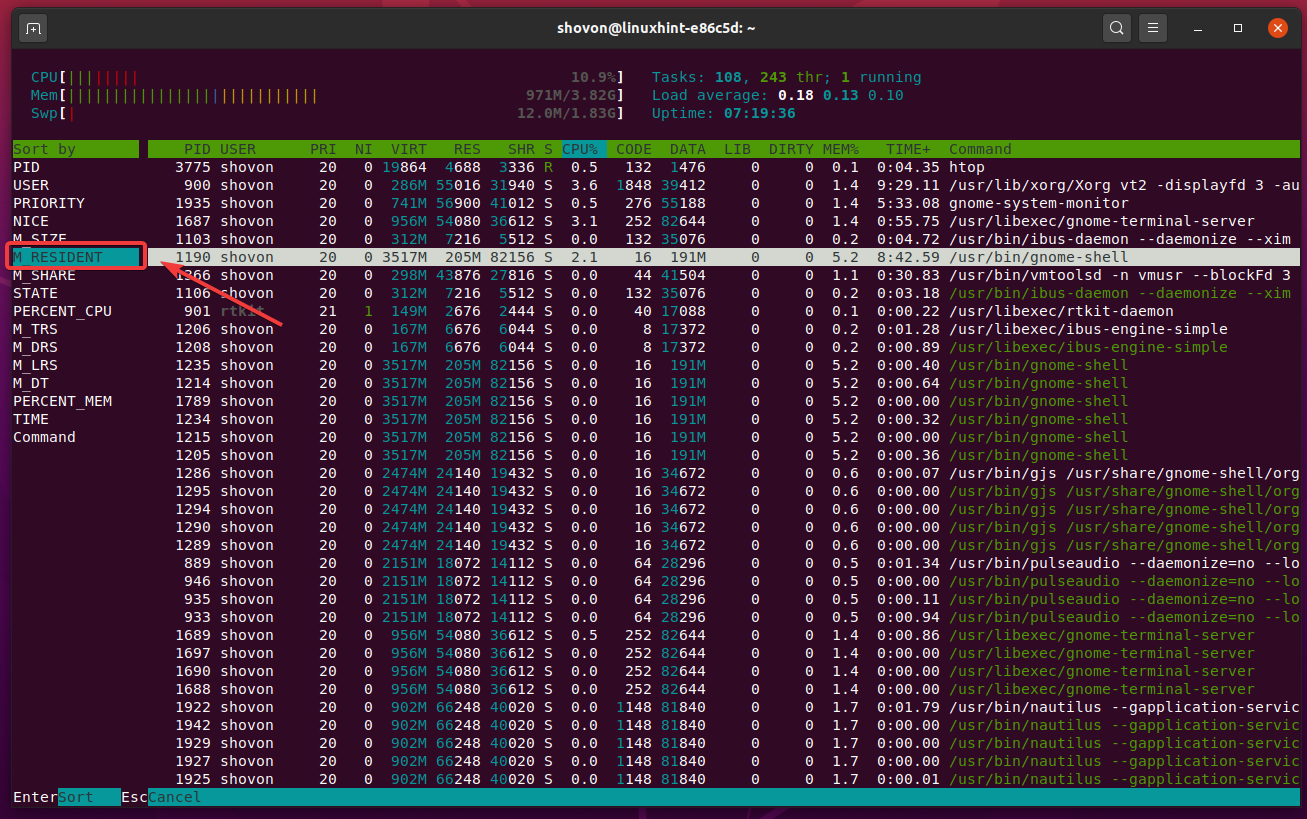
As you can see, the processes are nicely sorted by the resident memory usage.

The htop program lists a lot of processes. All of these processes can’t be shown in the limited window/screen size. But, you can press the <Up> and <Down> arrow keys to navigate the process list very easily.
Checking Memory Usage using smem:
Memory usage checking programs like top, htop, etc. shows the full shared memory for each of the processes. What it means is, even though the memory is shared by some processes, it counts this used memory for each of the processes sharing that memory. So, you get kind of incorrect memory usage information.
In mathematics, it looks like this,
smem tries to avoid this and report memory usage correctly. It divides the shared memory by the number of processes using that shared memory and adds the result to each of the processes sharing that memory. So, the memory usage adds up nicely. The total memory usage will be the summation of the memory usage of all the processes. This won’t happen in the htop or top.
In mathematics, it looks like this,
+ unshared memory
smem is not preinstalled by default in most of the Linux distributions. But it is available in the official package repository of most of the Linux distribution.
On Ubuntu/Debian, you can install smem with the following commands:
$ sudo apt install smem -y
On CentOS/RHEL 7, smem is available in the EPEL package repository. So, you must add the EPEL repository on CentOS/RHEL 7 to install smem.
On CentOS/RHEL 7, you can install smem with the following commands:
$ sudo yum install smem -y
Unfortunately, smem is not available in the official package repository or EPEL repository of CentOS/RHEL 8. You should be able to compile smem from source or download the smem binary from the official website of smem.
If you want to compile smem from the source, then you can download the smem source code from the official smem source page.
If you want to download a smem pre-compiled binary file, then you can download it from the smem official download page.
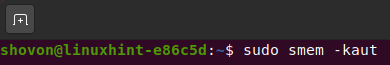
smem can display the memory usage of each user.
To know how much memory a Linux user uses, run smem as follows:
Here, the -k option is used to show the unit that smem is using to display memory usage information.
smem uses the following units:
K – Kibibyte
M – Mebibyte
G – Gibibyte
T – Tebibyte
P – Pebibyte
The -a option is used to scale the output columns depending on the window size of the terminal. This way, you can fix the output of smem very easily if any important text gets cropped.
The -u option is used to show user memory usage information.
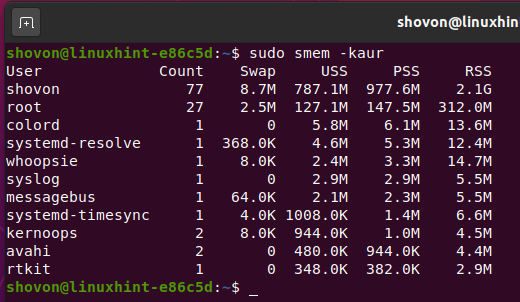
As you can see, smem reported the memory and swap usage information of each user of my Ubuntu machine.
smem shows the following user memory usage information:
User: The Linux username the memory usage is reported for.
Count: The number of processes the user is running at the moment.
Swap: The amount of swap disk space the user is using.
USS: This is the total Unique Set Size of the user processes. It is the total amount of physical memory the processes owned by the user are using that is not shared with other processes.
PSS: This is the total Proportional Set Size of the user processes. It is the total amount of physical memory and the evenly divided shared physical memory the processes owned by the user is using.
RSS: This is the total Resident Set Size of the user processes. It is the total amount of physical memory and the shared physical memory the processes owned by the user is using. RSS memory usage information of smem is the same as the RSS memory usage information of the top or htop.

By default, smem shows memory usage information in the ascending order (lowest to highest). If you want to see the memory usage information in descending order (highest to lowest), use the -r option of smem as follows:
As you can see, smem displayed the same user memory usage information. But in descending order.
If you want to see the total user memory usage information, run smem with the -t option as follows:
As you can see, smem adds the information of all the rows for each column and shows the total memory usage information of each of the columns at the end.

By default, smem shows memory usage information in the kibibytes unit. If you use the -k option, smem will automatically select the best unit to display the memory usage information.
If you want to display the memory usage information as a percentage of the total available physical memory or swap disk space, you can use the -p option instead of the -k option as follows:
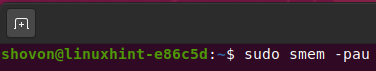
As you can see, smem displays the user memory usage information in the percentage of the total physical memory and swap disk space.

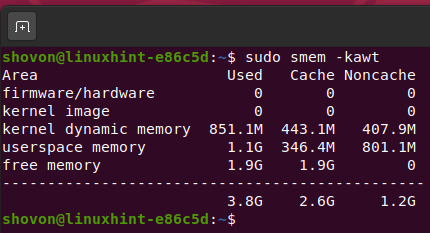
If you want to see the systemwide memory usage information or system memory usage summary, then run smem with the -w option as follows:

As you can see, smem displays systemwide memory usage information.
smem displays the following systemwide memory usage information:
Area: The part of the system the memory is used for.
Used: The amount of physical memory used for this area.
Cache: The amount of physical memory used as cache memory for this area.
Noncache: The amount of physical memory used for this area which is not cached.

The same way as before, you can use the -t option to see the total systemwide memory usage information as well.
You can also see the memory usage of the processes running on your Linux system with smem.
To do that, run smem as follows:
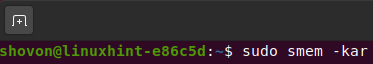
As you can see, smem displays the memory usage information of each of the processes running on my Ubuntu machine.
smem displays the following process-wise memory usage information:
PID: The Process ID of the process.
User: The username of the user that started the process or own the process.
Command: The command that is used to start the process.
Swap: The amount of swap disk space the process is using.
USS: This is the Unique Set Size of the process. It is the amount of physical memory the process is using that is not shared with other processes.
PSS: This is the Proportional Set Size of the process. It is the amount of physical memory and the evenly divided shared physical memory the process is using.
RSS: This is the Resident Set Size of the process. It is the amount of physical memory and the shared physical memory the process is using.

You can also see the memory usage information of each of the library file the processes are using with smem.
To see the memory usage information of each of the library file loaded into the physical memory of your computer, run smem with the -m option as follows:
smem will display the memory usage information of each of the library files loaded into the physical memory of your computer as you can see in the screenshot below.
smem shows the following library-wise memory usage information:
Map: The library file that is mapped to the physical memory of your computer.
PIDs: The total number of the processes using this library file.
PSS: This is the total Proportional Set Size of the processes using the library file. It is the amount of physical memory and the evenly divided shared physical memory the processes (using this library file) are using.
AVGPSS: This is the Average Proportional Set Size of the processes using this library file. It is the average physical memory that is shared between each of the processes (using this library file) are using. You can also say, AVGPSS = PSS/PIDs (about).

Checking Memory Usage using vmstat:
vmstat is another program for checking memory usage in Linux. It displays almost the same information as in /proc/meminfo file.
To see memory usage information, run vmstat as follows:
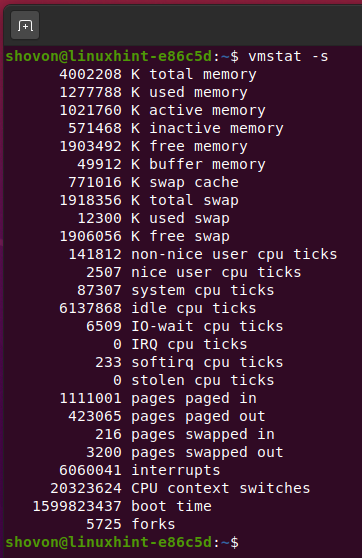
vmstat should show system-wide memory usage information in the kibibytes unit as you can see in the screenshot below.
vmstat shows the following memory usage information:
total memory: The total available physical memory of your computer.
used memory: The total used physical memory of your computer.
free memory: The total free physical memory of your computer.
total swap: The total available swap disk space.
used swap: The amount of swap disk space used.
free swap: The amount of swap disk space still free.
swap cache: The amount of swap disk space used as cache.
buffer memory: The amount of physical memory used as a buffer to hold the data temporarily while moving it from one place to another.
active memory: The amount of physical memory that is used but not reclaimable if required by other programs.
inactive memory: The amount of physical memory that is used but easily reclaimable by other programs if needed.
Checking Memory Usage using GNOME System Monitor:
GNOME System Monitor is a graphical software for monitoring memory usage, running processes, and disk usage. It is preinstalled on GNOME 3, Ubuntu MATE, Cinnamon, and, Budgie desktop environments.
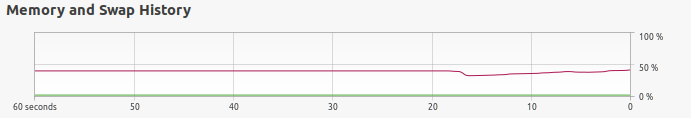
You can see memory and swap usage information in the Resources tab of GNOME System Monitor as you can see in the screenshot below.
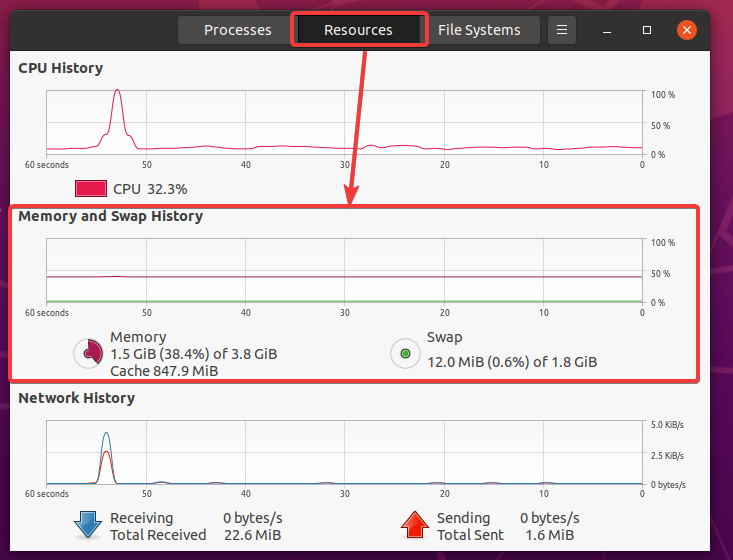
It shows a nice real-time memory and swaps usage graph for the last 60 seconds. You can have an idea of how much memory and swap usage varied overtime from this graph.
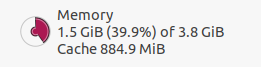
It will show the total available physical memory, the amount of physical memory used, the percentage of physical memory used, and the amount of physical memory used as cache memory. It will also show you a nice physical memory usage pie chart.
It will also show the total available swap disk space, the amount of swap space used, the percentage of the amount of swap space used, and a nice swap usage pie chart.

In the Processes tab of GNOME System Monitor, you can see the memory usage information of each of the processes running on your computer.

If you want to see more memory usage information for the processes, right-click (RMB) on the title bar and check the Virtual Memory, Resident Memory, and Shared Memory as shown in the screenshot below.
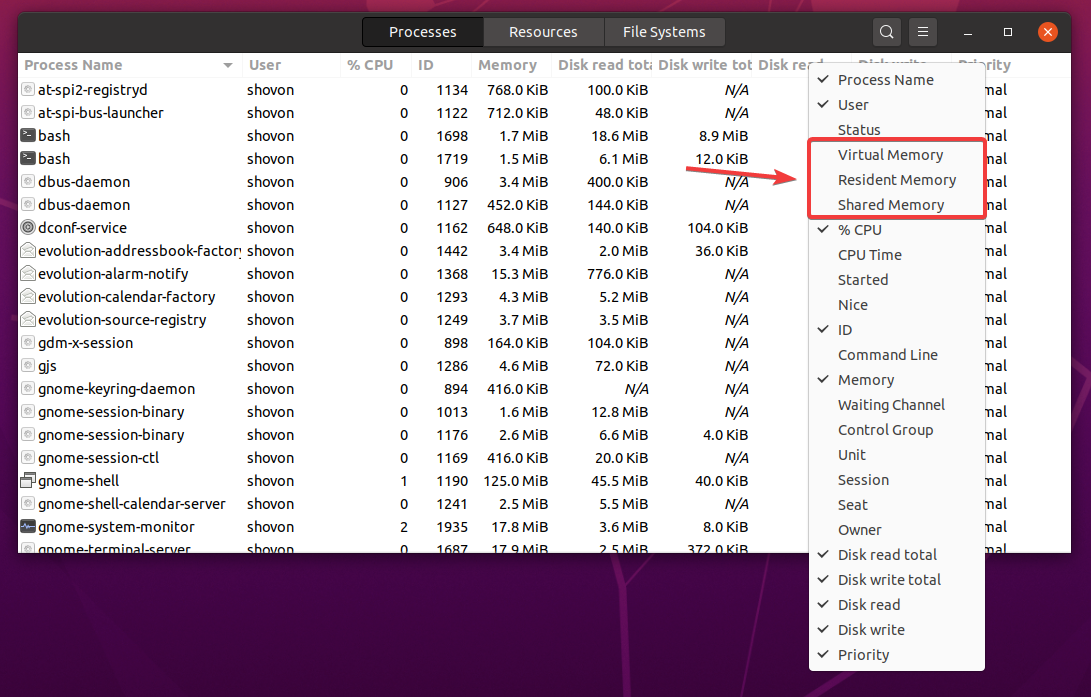
The Virtual (VIRT), Resident (RES), and Shared (RSS) memory usage information of the processes should be displayed as you can see in the screenshot below.
This memory usage information is the same as in the top or htop.

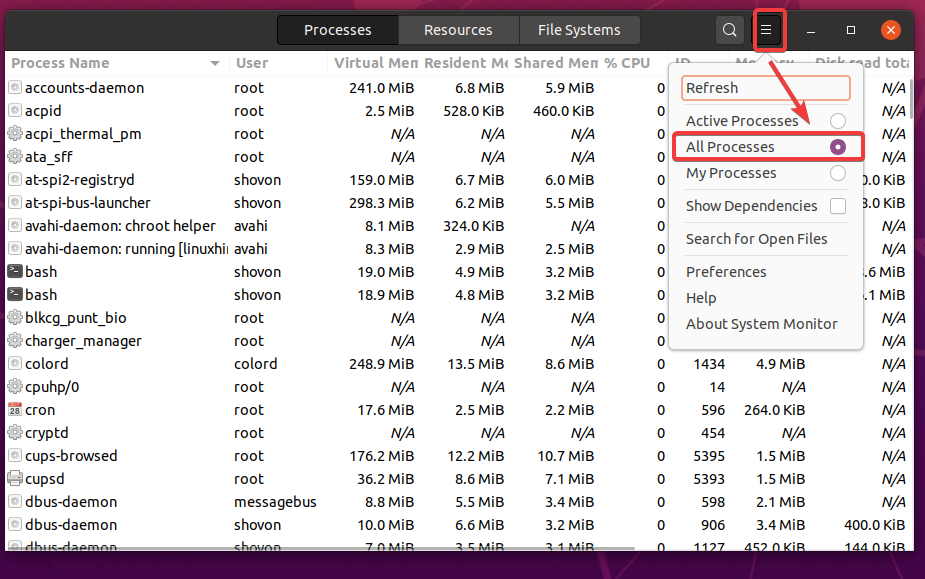
By default, GNOME System Monitor will show only the processes owned by your login user. If you want to see a list of all the processes owned by every user of your system, then click on the hamburger menu (
![]()
) and select All Processes as shown in the screenshot below.
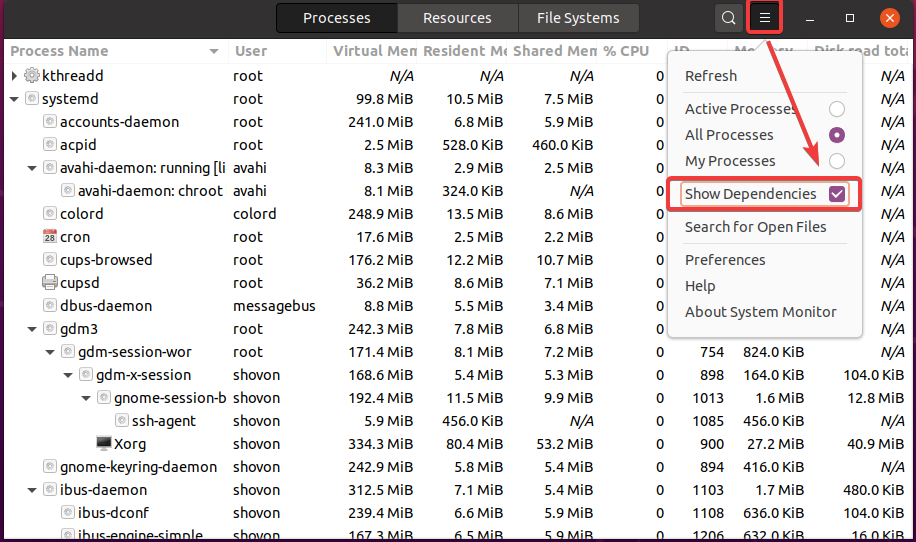
If you want to see the processes in tree view (parent-child relationship), then click on the hamburger menu (
![]()
) and check Show Dependencies as shown in the screenshot below.
In the tree view, you can see which process (parent) started which processes (child) in the order they were started. You can also see how much memory each of the parent processes consumes and how much memory each of the child processes consumes.
Checking Memory Usage using KSysGuard:
KSysGuard is a graphical software for monitoring memory usage and running processes. It is preinstalled on the KDE Plasma desktop environment.
You can see memory and swap usage information in the System Load tab of KSysGuard as you can see in the screenshot below.

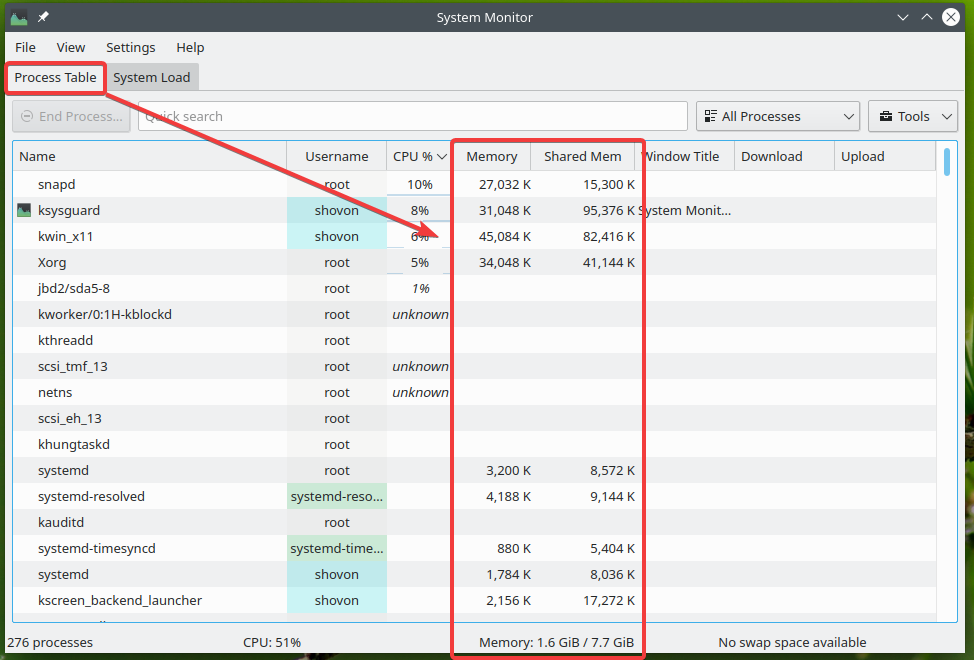
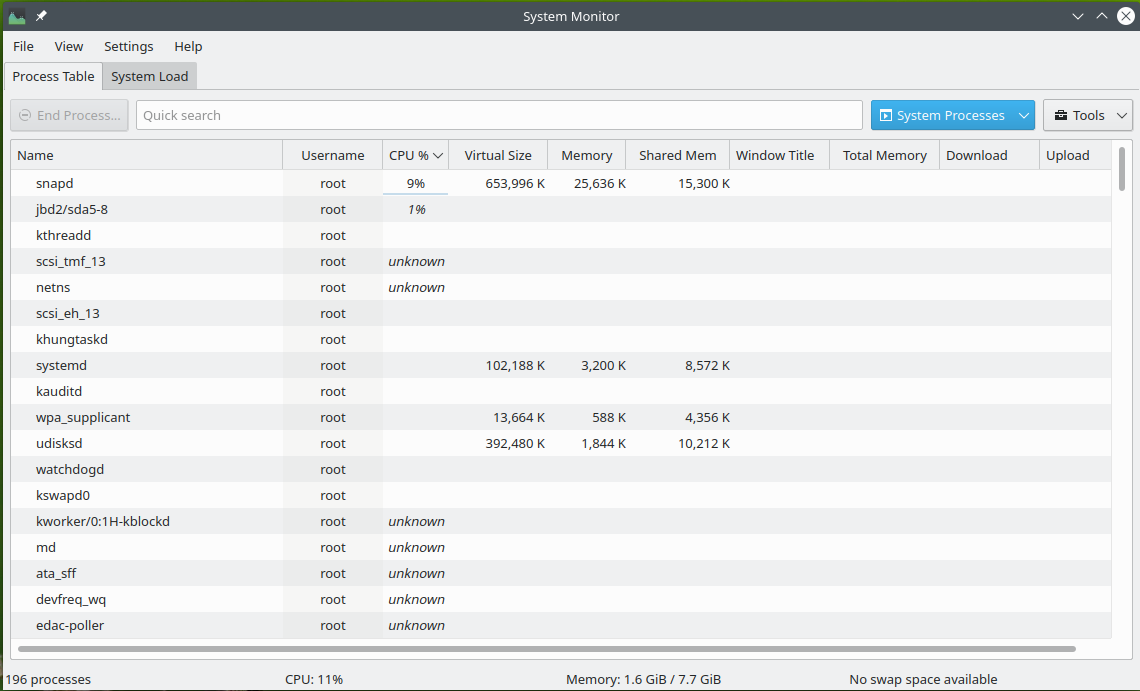
In the Process Table tab of KSysGuard, you can see the memory usage information of each of the processes running on your computer.
By default, KSysGuard shows the physical memory and shared memory usage info for each of the running processes.
You can right-click (RMB) on the title bar and click on Show Column ‘Virtual Size’ and Show Column ‘Total Memory’ to see more memory usage information.
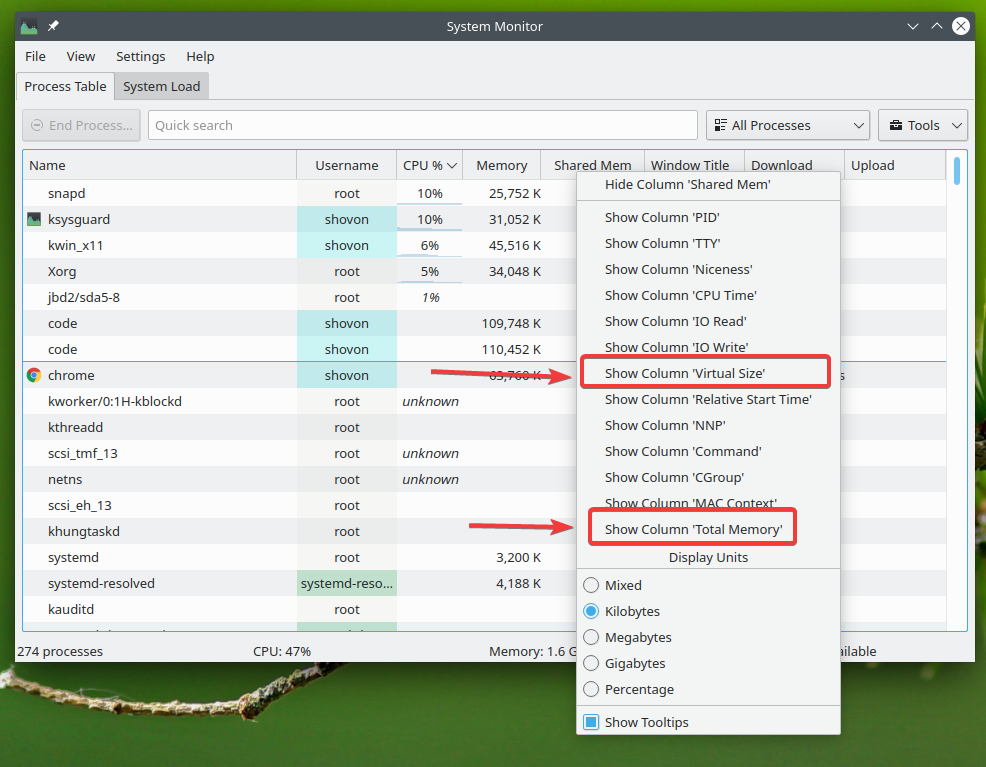
As you can see, KSysGuard now shows the virtual memory size (VIRT) and the total physical memory usage for each of the running processes as well.

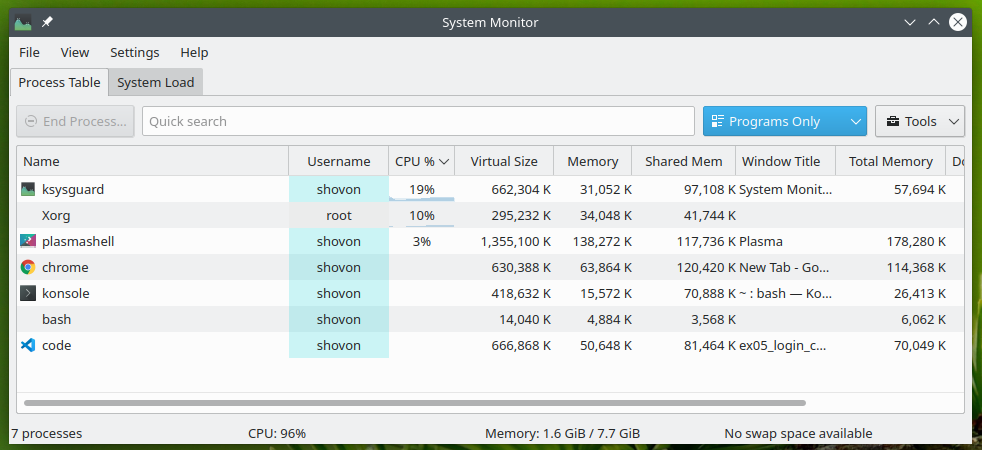
By default, KSysGuard shows all the running processes owned by every user in the Process Table tab. You can change what processes you want to see from the dropdown menu in the top right corner of KSysGuard as shown in the screenshot below.
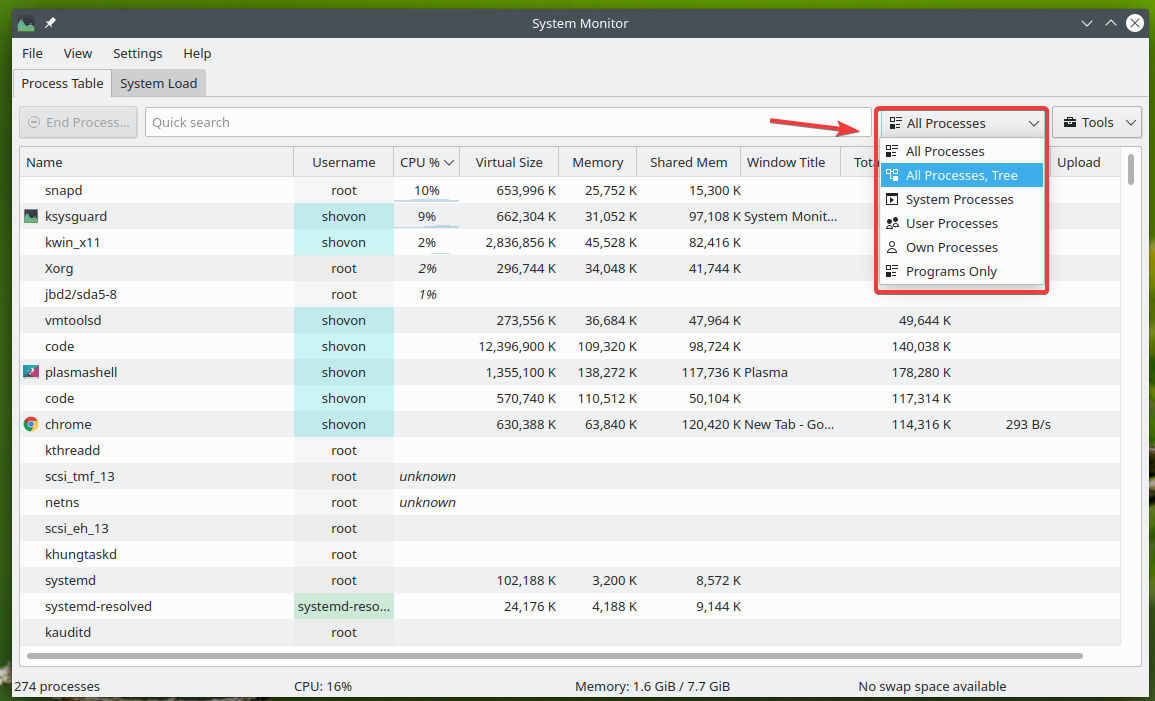
For tree view, select All Processes, Tree from the dropdown menu.
In the tree view, you can see which process (parent) started which processes (child) in the order they were started. You can also see how much memory each of the parent processes consumes and how much memory each of the child processes consumes.

If you only want to see the system-level processes, select System Processes from the dropdown menu. These processes are usually owned by the root user.
If you want to see user-level processes, select User Processes from the dropdown menu. These processes are usually owned by ordinary users (non-root).

If you want to see only the processes that are owned by the login user, select Own Processes.

If you want to see only the programs running on your computer, not processes, then select Programs Only from the dropdown menu. Only the application programs running on your computer will be listed.
Conclusion:
In this article, I have covered the most common ways to check memory usage on Linux. I have shown how to check memory usage of Linux systems from the command-line as well as from graphical desktop environments. I have explained how to use programs such as free, top, htop, smem, vmstat, GNOME System Monitor, and KSysGuard to check for memory usage of Linux. I have also discussed the output format of these commands and programs. This article should get you started with Linux memory usage checking and give you an in-depth knowledge of the Linux memory usage checking tools.