Through this post, you will discover how to enable and disable query tracing in Cassandra nodes.
Cassandra TRACING Command
Cassandra provides us with the TRACING command, which can be executed in the CQL Shell. This command allows you to enable or disable tracing for all the queries executed in the nodes of a given cluster.
Tracing allows you to collect logs of any transaction performed on the server. The trace logs are then stored in the system_traces keyspaces, which will expire after a given TTL duration. By default, the traces are stored in the table for 24 hours. However, you can modify the TTL value or move the traces to another key space.
In addition, the system_traces keyspace contains tables such as the session, which holds session information, and the events table, which has detailed information about the queries.
The tracing command syntax is as shown:
Example
The following example shows how to enable TRACING in a four-node cluster. We will then test the tracing capabilities by creating sample data.
To enable tracing, run the command:
Now Tracing is enabled
Next, let us create a keyspace and sample table.
Once we run the command above, the CQL Shell should return tracing messages of the command as shown below:
activity | timestamp | source | source_elapsed | client
---------------------------------------------------------------------------------------------------------------------------------------+----------------------------+-----------+----------------+-----------
Execute CQL3 query | 2022-09-14 11:27:22.119000 | 127.0.0.1 | 0 | 127.0.0.1
Parsing create keyspace store with replication = { 'class': 'SimpleStrategy', 'replication_factor': 4}; [Native-Transport-Requests-1] | 2022-09-14 11:27:22.119000 | 127.0.0.1 | 657 | 127.0.0.1
Preparing statement [Native-Transport-Requests-1] | 2022-09-14 11:27:22.121000 | 127.0.0.1 | 2168 | 127.0.0.1
Appending to commitlog [MigrationStage:1] | 2022-09-14 11:27:22.132000 | 127.0.0.1 | 13136 | 127.0.0.1
Adding to keyspaces memtable [MigrationStage:1] | 2022-09-14 11:27:22.133000 | 127.0.0.1 | 13941 | 127.0.0.1
Appending to commitlog [CompactionExecutor:3] | 2022-09-14 11:27:22.400000 | 127.0.0.1 | 280829 | 127.0.0.1
Adding to compaction_history memtable [CompactionExecutor:3] | 2022-09-14 11:27:22.400000 | 127.0.0.1 | 281512 | 127.0.0.1
Appending to commitlog [CompactionExecutor:4] | 2022-09-14 11:27:22.498000 | 127.0.0.1 | 379253 | 127.0.0.1
Adding to compaction_history memtable [CompactionExecutor:4] | 2022-09-14 11:27:22.498000 | 127.0.0.1 | 379782 | 127.0.0.1
Appending to commitlog [CompactionExecutor:3] | 2022-09-14 11:27:22.627000 | 127.0.0.1 | 508643 | 127.0.0.1
Adding to compaction_history memtable [CompactionExecutor:3] | 2022-09-14 11:27:22.628000 | 127.0.0.1 | 509209 | 127.0.0.1
Appending to commitlog [CompactionExecutor:4] | 2022-09-14 11:27:22.778000 | 127.0.0.1 | 659647 | 127.0.0.1
Adding to compaction_history memtable [CompactionExecutor:4] | 2022-09-14 11:27:22.779000 | 127.0.0.1 | 660218 | 127.0.0.1
Executing seq scan across 2 sstables for (min(-9223372036854775808), min(-9223372036854775808)] [MigrationStage:1] | 2022-09-14 11:27:22.846000 | 127.0.0.1 | 726928 | 127.0.0.1
Read 66 live rows and 0 tombstone cells [MigrationStage:1] | 2022-09-14 11:27:22.851000 | 127.0.0.1 | 732009 | 127.0.0.1
Appending to commitlog [CompactionExecutor:3] | 2022-09-14 11:27:22.852000 | 127.0.0.1 | 733610 | 127.0.0.1
-----------------OUTPUT TRUNCATED-------------------
We can then create a table and perform a write operation as shown:
Similarly, the command should return the tracing log as:
We can insert sample data as:
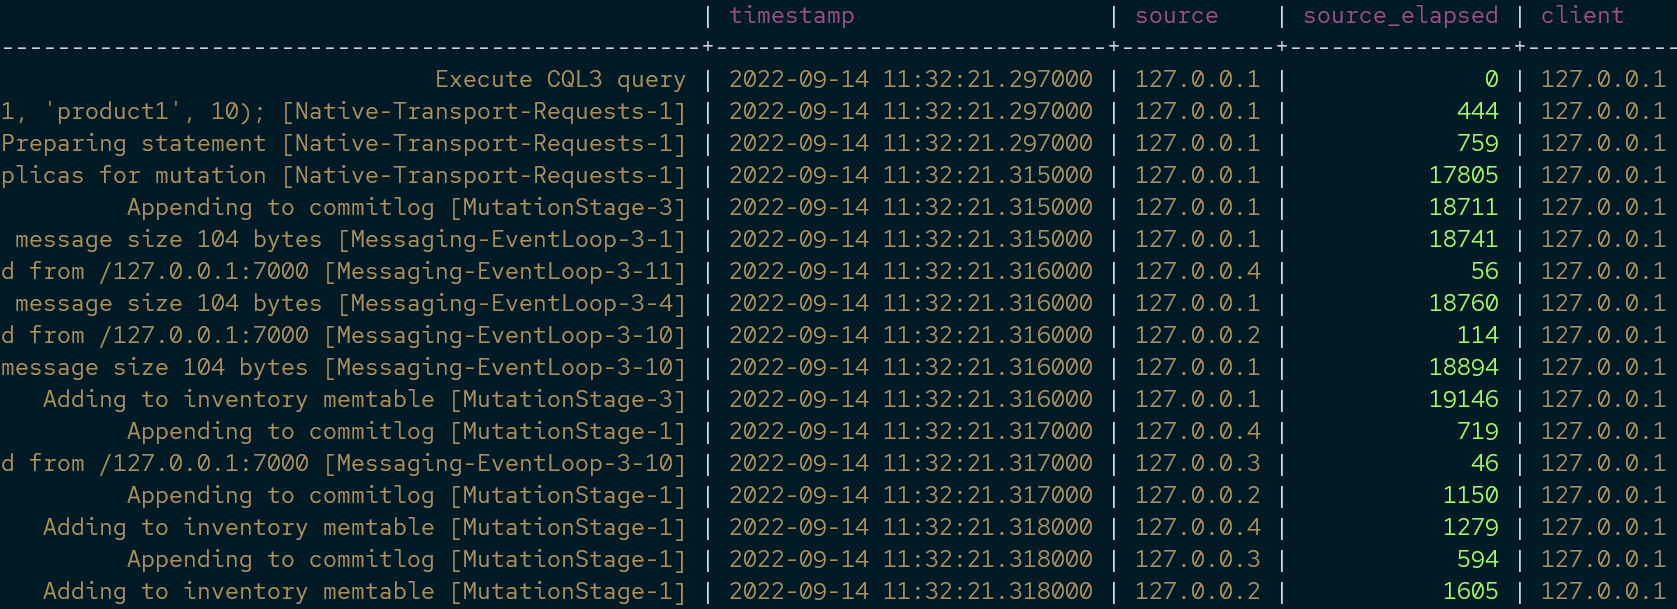
The write request produces the trace as shown:
Finally, we can select the items from the table which should return the trace for a sequential scan as shown:
Trace output:
Conclusion
This article discussed how you could enable query tracing in your Cassandra cluster using the tracing command.


