Main Features of Btop++
Btop++ is a cross-platform command line utility and it can run on Linux, Windows and macOS. It comes with support for mouse controls so that you can fully navigate it through mouse inputs only. Btop++ comes with a handful of layout presets that you can use to quickly change the look and feel of it. You can configure its various options using a built-in preferences menu that works in the terminal itself. It includes an option to show both summarized and detailed stats. Other main features of Btop++ include its ability to sort and filter processes, a built-in tree-view layout, graphs and plots showing overtime consumption of resources, battery indicator, colored output, vim style keyboard shortcuts, customizable themes, and a built-in clock.
Installing Btop++ in Linux
You can download executable binaries of Btop++ for all major Linux distributions from its GitHub releases page. Further installation and source code compilation instructions are available here. Source code is available on GitHub.
Running Btop++ in Linux
Once you have downloaded Btop++ from GitHub releases page, extract the compressed archive and locate Btop++ executable binary in the “bin” folder. Mark it executable using the following command:
Now you can run Btop++ on your Linux system using the following command:
In case you get a “locale” or “language” error, use the following command instead:
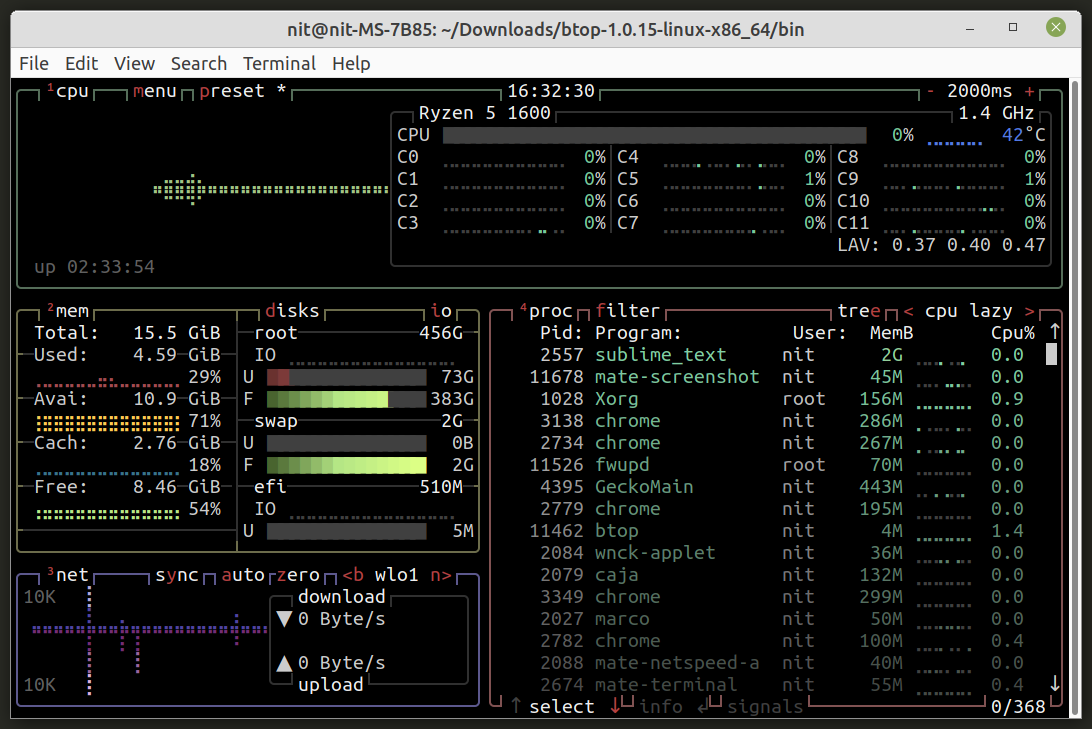
After running Btop++, depending on various hardware components present in your Linux system, you should see a terminal based system resource monitor similar to this:
As you can see in the screenshot above, Btop++ shows useful information in a grid-like layout about resource consumption on your Linux system.
Changing Btop++ Layout using Presets
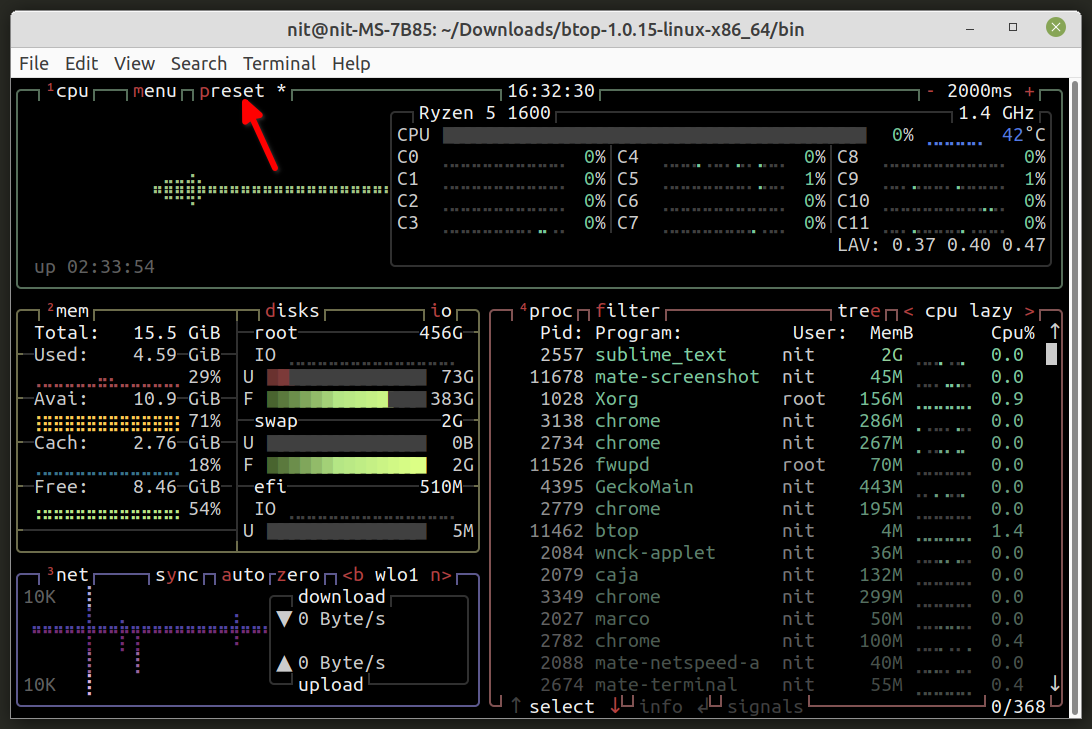
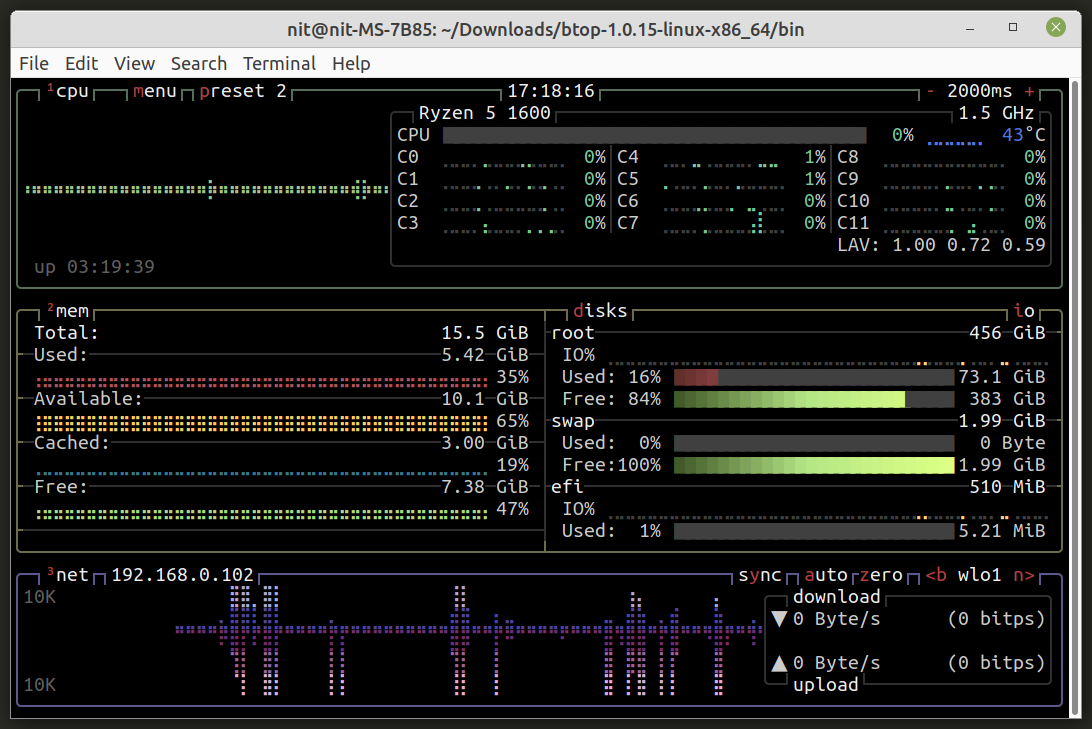
Depending on the source of installation, Btop++ comes with three or more predefined layout presets and it allows you to quickly change the structure of Btop++ system monitor using these presets. To do so, click on the “preset” button located on the top toolbar to cycle between various available prestes.
Here is a screenshot showing layout of preset # 2.
Configuring Btop++
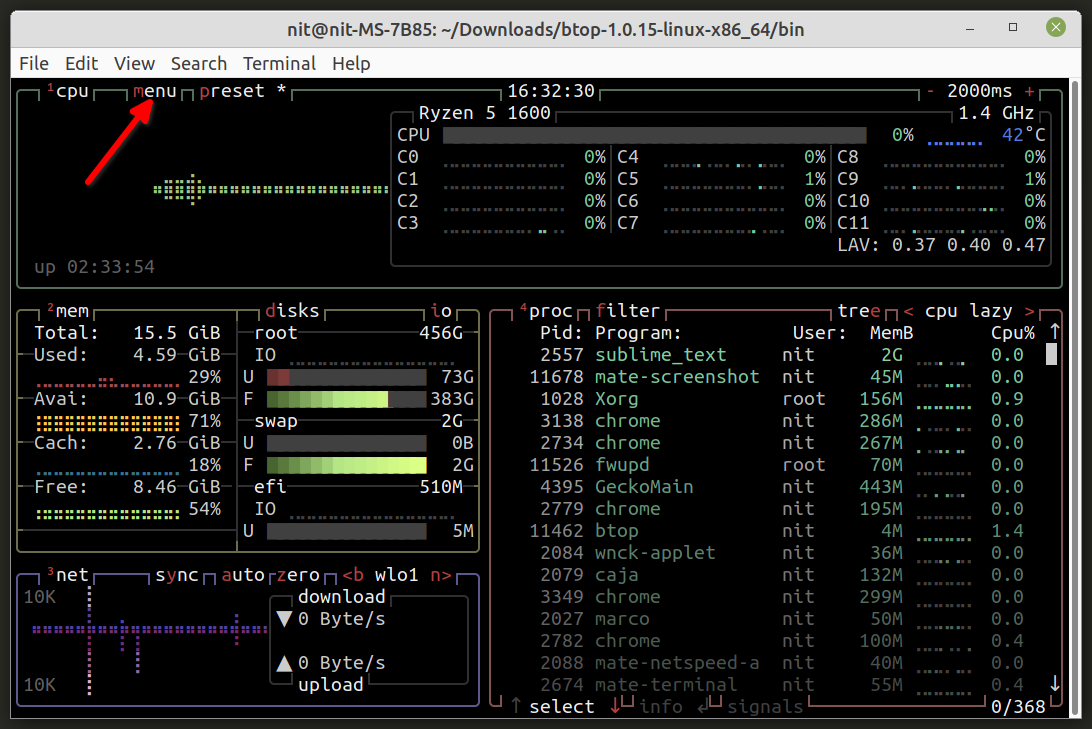
You can easily configure and customize Btop++ using its built-in configuration menu. To do so, click on the “menu” button located on the top toolbar.
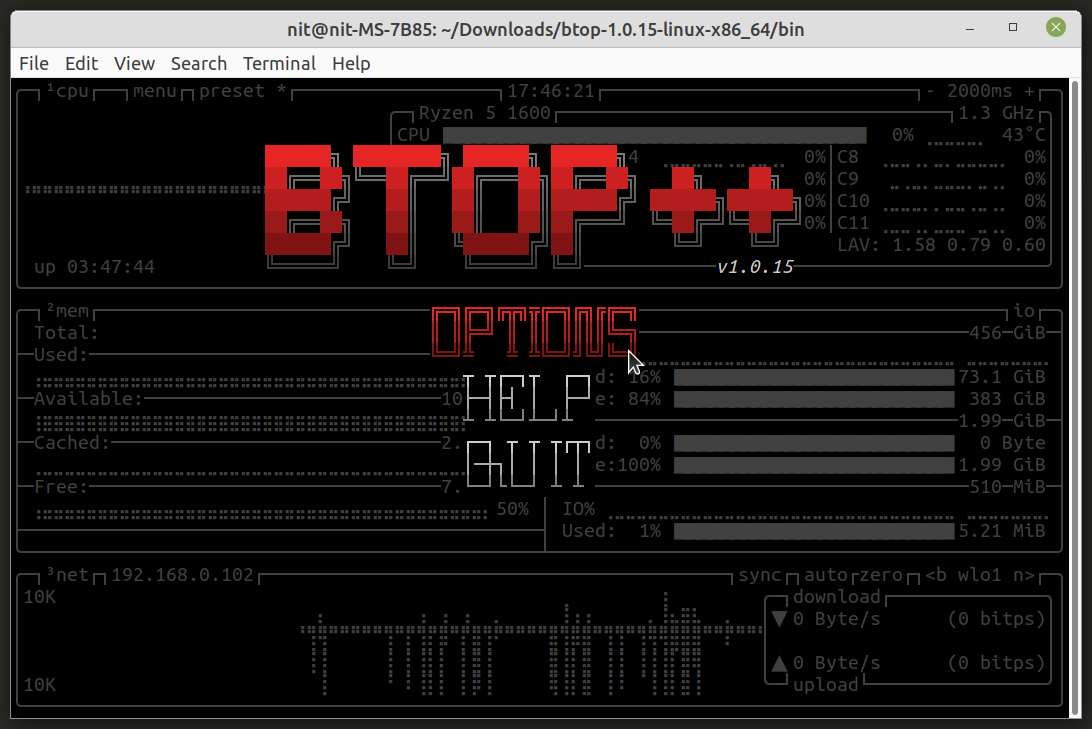
You will get a small popup within the terminal window. Click on the “OPTIONS” menu entry.
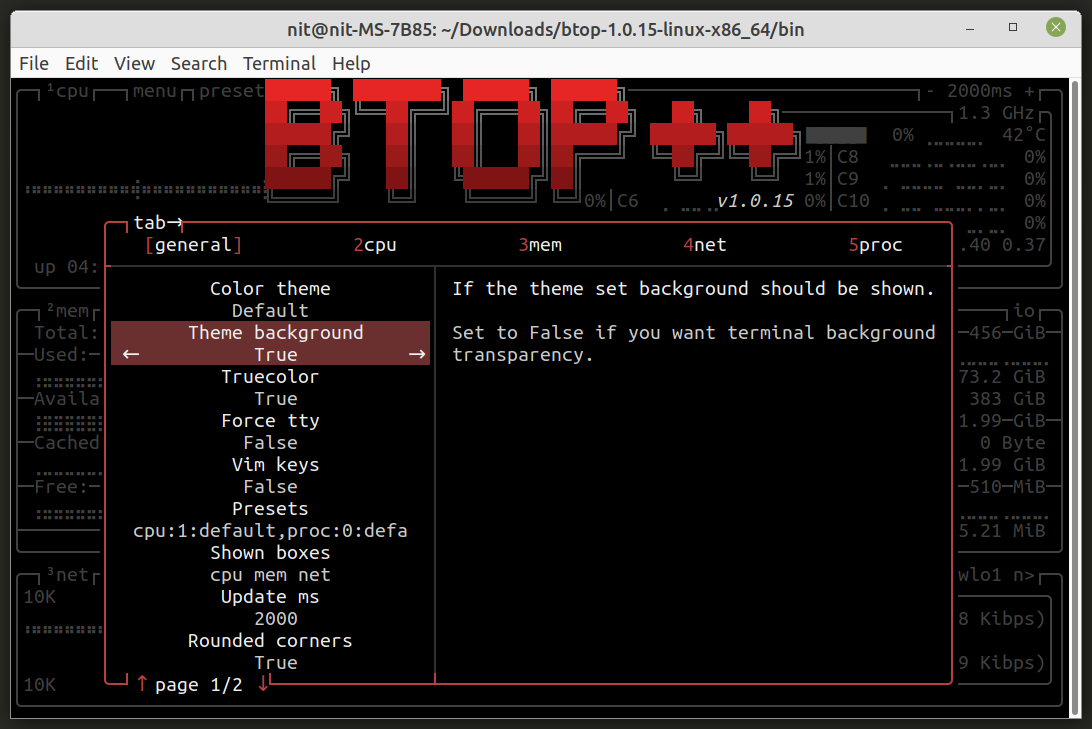
A detailed configuration window will be shown on screen. Just navigate through the tabs on the left side to change various settings for Btop++.
Sorting and Filtering Data
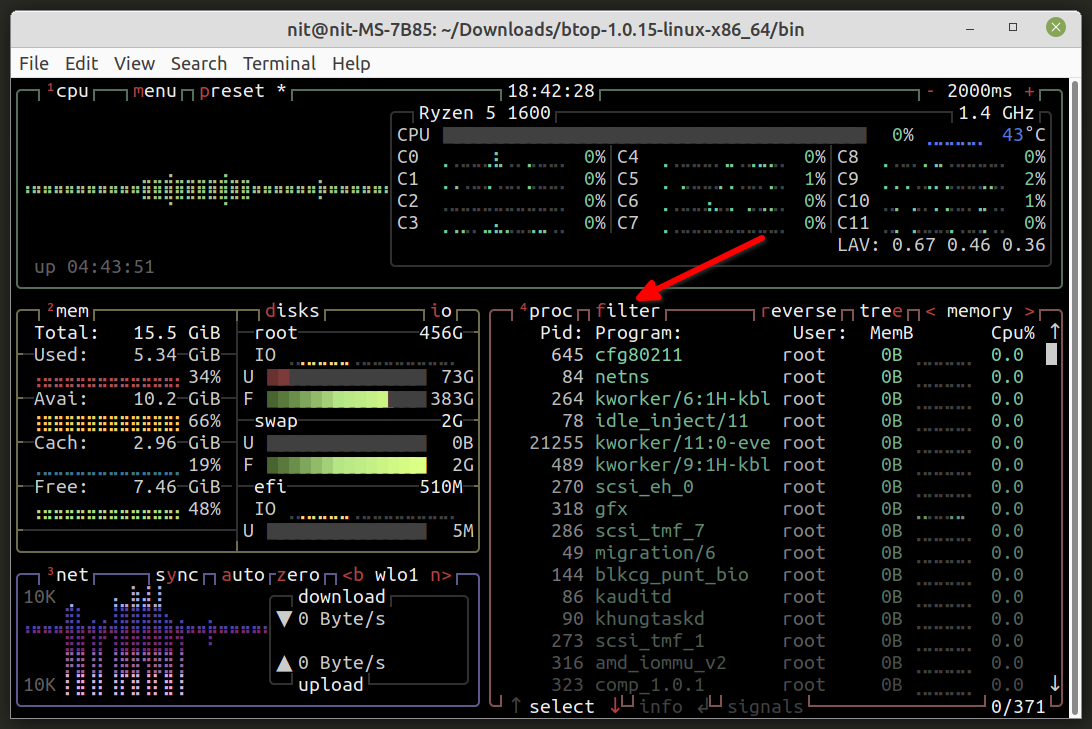
In order to sort and filter tabular data presented in Btop++, you will need to click on small header buttons located just above various columns in the tabular data. For instance, to filter the running processes, you will need to click on the “filter” button, located just above one of the columns in tabular data (as shown in the screenshot below):
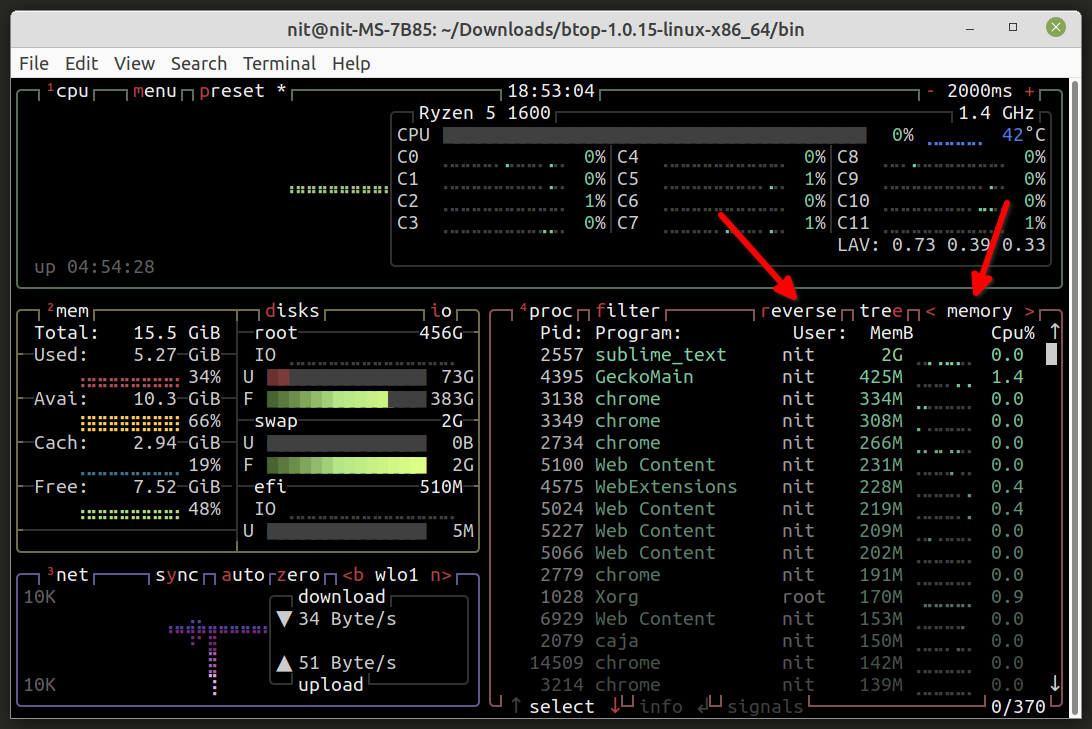
To sort results, you will need to click on “<” and ” >” arrow symbols located near one of the column headers (as shown in the screenshot below). You can change sort order by clicking on the “reverse” button.
You can click on any column header on any grid to sort and filter items interactively.
Conclusion
Btop++ is a comprehensive system monitoring tool that can be used to keep track of resource consumption on your Linux system. It comes with a user-friendly, terminal based user interface that can be controlled and navigated through both keyboard and mouse inputs. You can also change its look and feel using customizable themes and layout presets.

