Numastat is a command-line utility used to display per-NUMA node memory for the processes and the operating systems. It also displays the administrators when the process memory will be distributed across the system.
We cover what the “numastat” command is and how it works with different options in this post.
Installing Numastat:
Numastat is not pre-installed in the Linux system. Numactl provided its packages to Numastat. So, we need to install numactl:
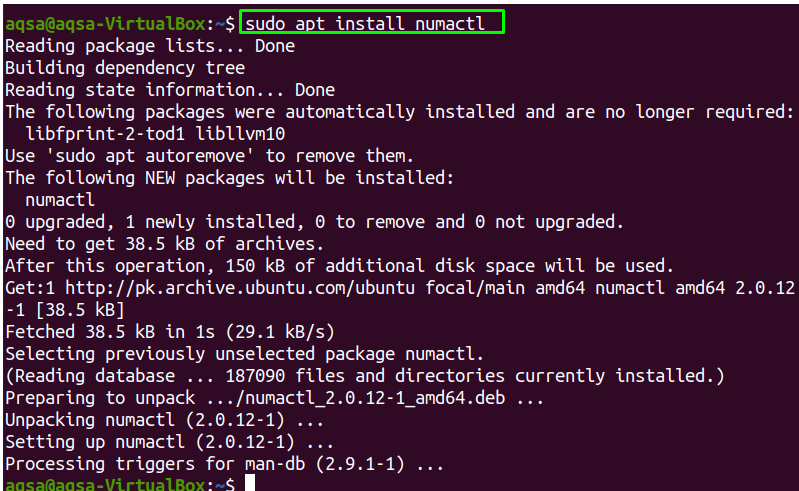
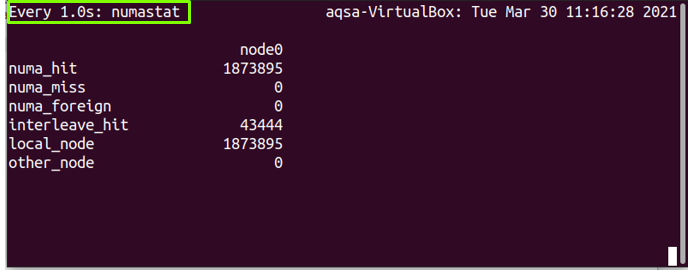
Upon the installation of numactl, type “numastat” with no parameter in the terminal. It will show the per-node NUMA hit, miss system statistics, and some other information from kernel memory allocation.
As you can see the result, the per-node numbers of “numastat” are divided into different classes:
- numa_hit: It shows that the memory has been allocated successfully.
- numa_miss: is a memory that was planned for another node but allocated to this node.
- Numa_foreign: It is a memory planned for this node but allocated to another node instead of the planned ones.
- Interleave_hit: On this node, interleaved memory was successfully allocated as planned.
- local_node: Memory was allocated when the process was running.
- other_node: Memory was assigned on this node when a process was running on any other node.
Syntax:
The syntax of the “numastat” command would be:
Options:
The “numastat” command works with multiple options; let’s check the functionalities of these options:
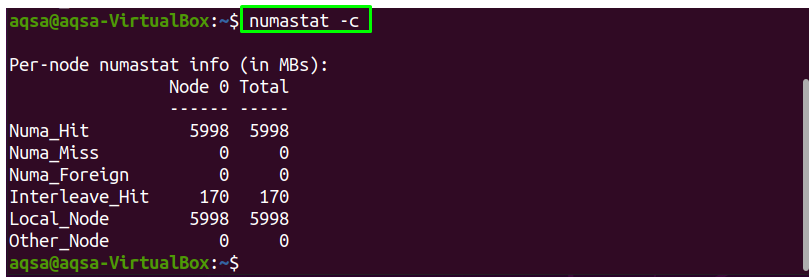
Numastat -c:
Use the “-c” option to shrink the column width in response to data content; it will show the memory size in megabytes:
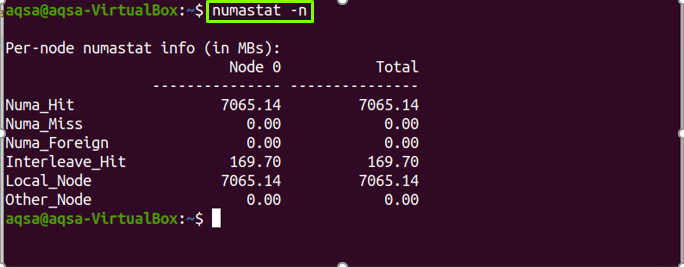
Numastat -n:
Use the “-n” option to show the original numastat statistics information. It will display the same information as numastat, but the memory unit will be in megabytes, and the layout or format will vary from the original one:
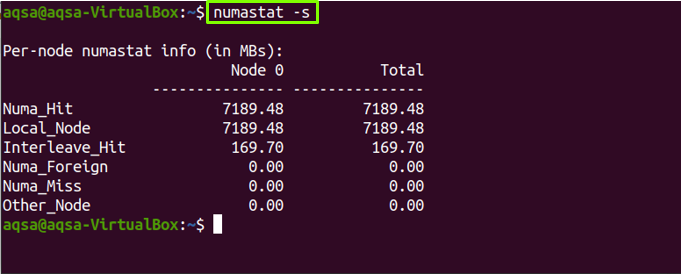
Numastat -s:
Use the “-s” option to display the data from higher to lower values. The highest memory will be shown on top:
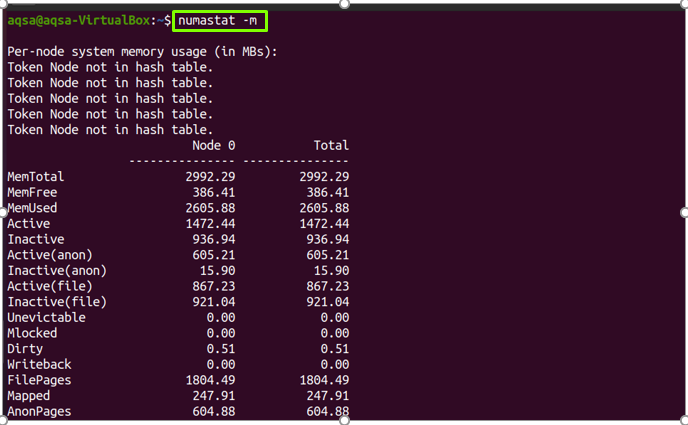
Numastat -m:
Use the “-m” option to display system memory allocation data in a meminfo-like format. It also generates a per-node breakdown of memory usage data:
Numastat -z:
Use the “-z” option to show only non-zero values. If it still shows “zero” in columns and rows, that means there is only one non-zero value but rounded it as zero:
Numastat -p:
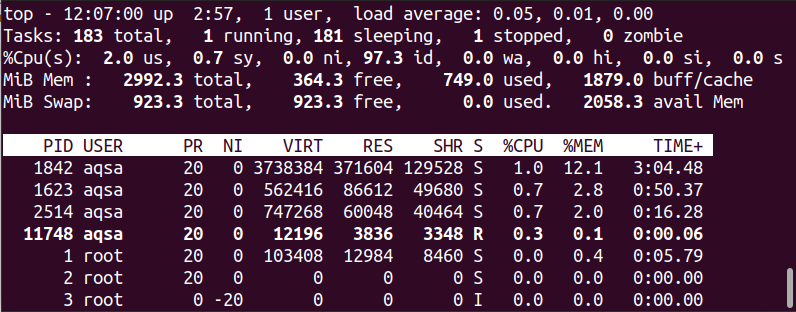
To get the information of specific process id. First, run the “ps” or “top” command to show the currently executing processes.
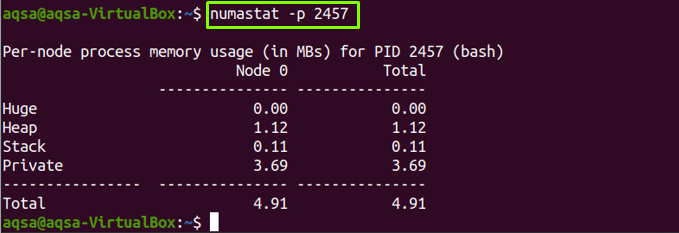
Use the “-p” option with process ID to show the per-node memory allocation information of any specific PID:
For example, I want to fetch the information of process 2457:
Numastat -v:
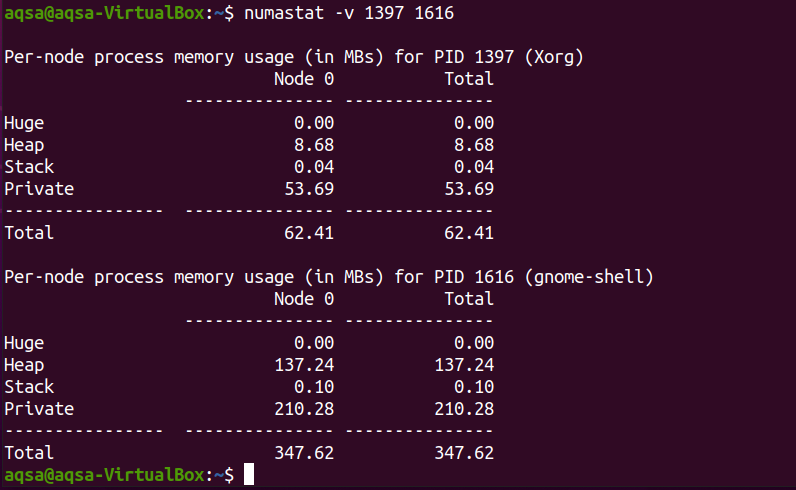
The “-v” option makes reports more verbose. You can also use multiple process ids (PIDs) to print their information:
For example:
Watching numastat:
This command will keep a watch on the changing memory node values by the assigned time. Add a time unit with the “-n” option. 1 indicates one second:
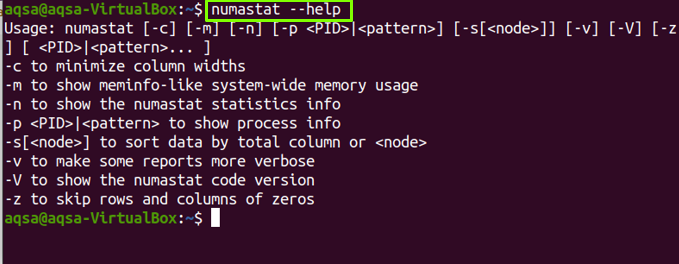
Numastat –help:
Use the “–help” option to print the help information:
Numastat -V:
Use the “-V” option to display the version of the numastat tool:
Conclusion:
The “numastat” tool is used in the Linux operating system, displaying node memory statistics of processes and operating systems from the kernel memory allocator. Each NUMA has different memory policies. Numastat makes an effort to display a table that would be conveniently readable on the terminal. Therefore, “Numastat” assumes that terminal width consists of 80 characters, so it always displays the output accordingly. We have covered the “numstat” command with its option in detail.


