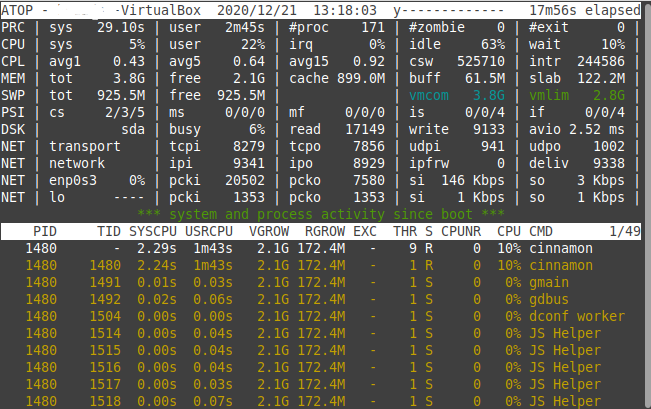
If you perform some resource-hungry operations on your Linux server, it is mandatory for you to analyze its performance continuously. The Advanced System and Process Monitor, or “atop” is a very useful utility for the Linux environment that is used to analyze the server’s performance. It can either be used to generate a detailed Linux server performance report, or you can even view specific performance statistics. We will be going to elaborate on the procedures of doing all this with you in today’s article.
Note: We will be using Linux Mint 20 for analyzing the Linux server performance with “atop”.
Analyzing Linux Server Performance with the “atop” Utility
For analyzing your Linux server’s performance with “atop”, you should ideally perform all the steps listed over here:
Step 1: Update your Linux Mint 20 System
Before installing the “atop” utility on your Linux Mint 20 system, you have to update it by executing the below-affixed command:
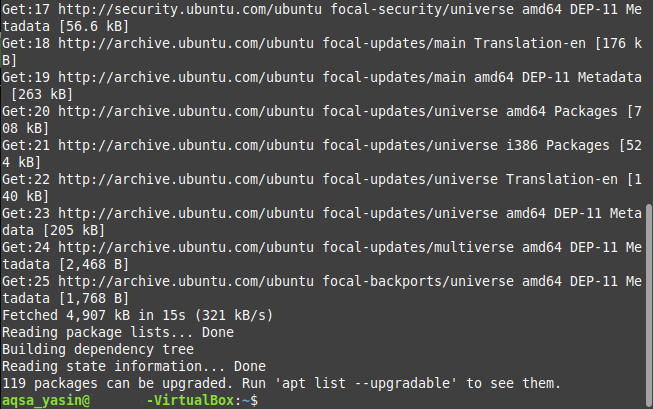
When the Linux Mint 20 system updates, it will cause the messages shown in the image below to appear on your terminal:
Step 2: Install the “atop” utility on your Linux Mint 20 System
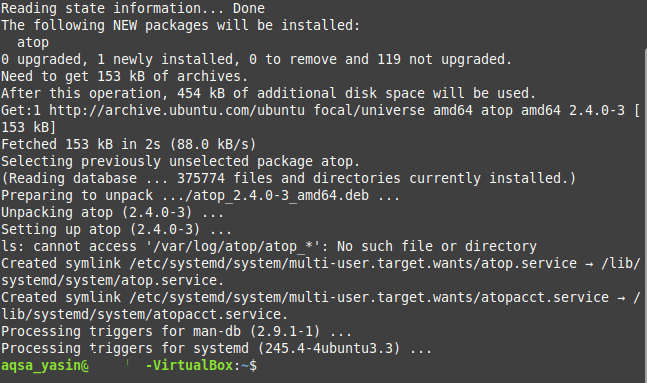
For installing the “atop” utility on your Linux Mint 20 system, you have to run the following command:
The “atop” utility will take some time to install, after which you will be capable of using it immediately.
Step 3: Check the Manual for the “atop” Utility
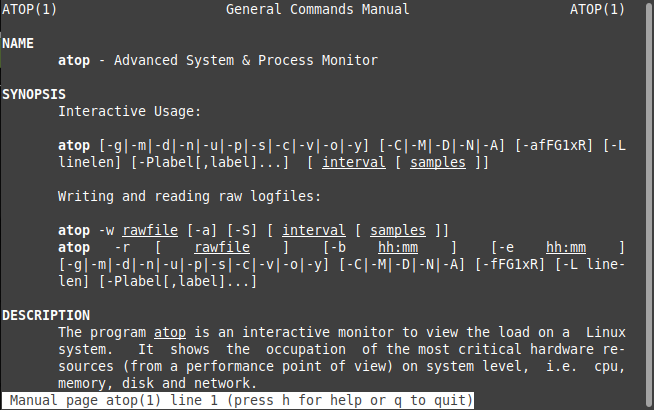
There is a dedicated manual for the “atop” utility, which you can check out before using this utility. This manual will help you a lot in understanding the proper working and usage of this utility. The manual of “atop” can be accessed by running the following command:
The main pages of the “atop” utility are shown in the image below:
Step 4: Check the Help Pages for the “atop” Utility
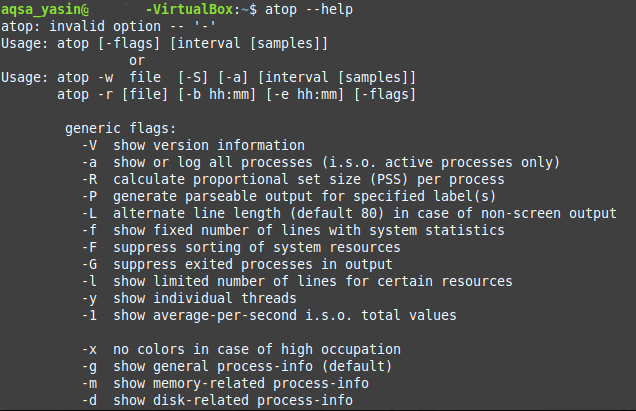
For knowing about the different variations and options that can be used with the “atop” utility in Linux Mint 20, you can access its help pages with the following command:
The help pages of the “atop” utility are shown in the image below:
Step 5: Run the “atop” utility on your Linux Mint 20 System to Analyze its Performance
Once we have clearly understood the usage of the “atop” utility, we can easily run it on Linux Mint 20 to analyze its performance in the following manner:
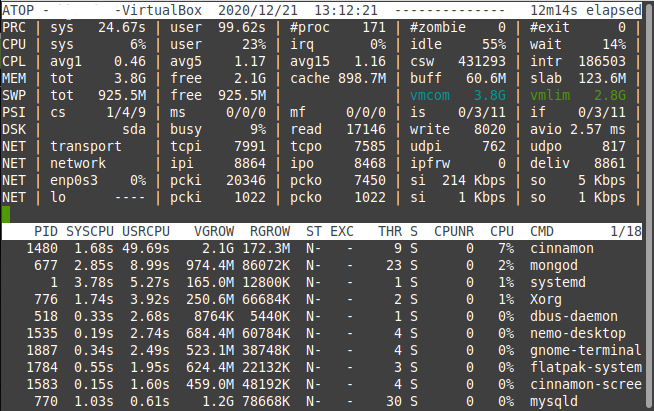
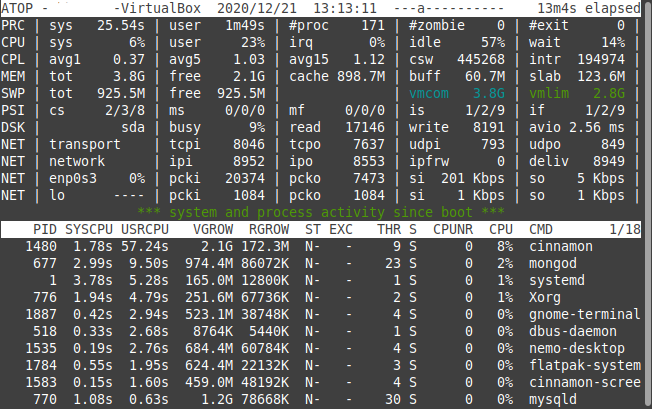
The standard performance output of the Linux Mint 20 system by running the “atop” utility on it is shown in the image below:
Some Specific Uses of the “atop” Utility
Above, we have seen a very comprehensive Linux server performance report generated by the “atop” utility in Linux Mint 20. However, if you only wish to view some specific performance statistics, then you can use the methods shown below:
Check the Active Processes with the “atop” Utility
For checking the information related to the active processes only using the “atop” utility, you can use it in the following manner:
The performance information regarding the active processes in Linux Mint 20 is shown in the image below:
Check the Disk Info with the “atop” Utility
For checking all the disk-related information only using the “atop” utility, you can use it in the following manner:
In our case, since no disk related activity was taking place at the moment, we run this command; that is why no specific disk-related information was available, as shown in the image below. However, if you will run the “atop” utility in this manner on your machine while your disk is being engaged, then you will surely be able to see all the relevant information.
Check the Memory Info with the “atop” Utility
For checking all the memory-related info only using the “atop” utility, you can use it in the following manner:
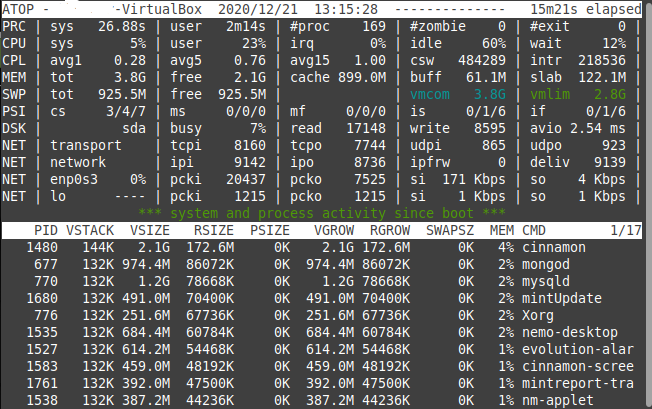
The memory information regarding our Linux Mint 20 system is shown in the image below:
Check the Network Info with the “atop” Utility
For checking all the network-related info only using the “atop” utility, you can use it in the following manner:
In our case, since the network kernel module was not active at the moment, we run this command; that is why no specific network-related information was available, as shown in the image below. However, if you will run the “atop” utility in this manner on your machine while your network kernel module is active, then you will surely be able to see all the relevant information.
Check the Scheduling Info with the “atop” Utility
For checking all the scheduling info only using the “atop” utility, you can use it in the following manner:
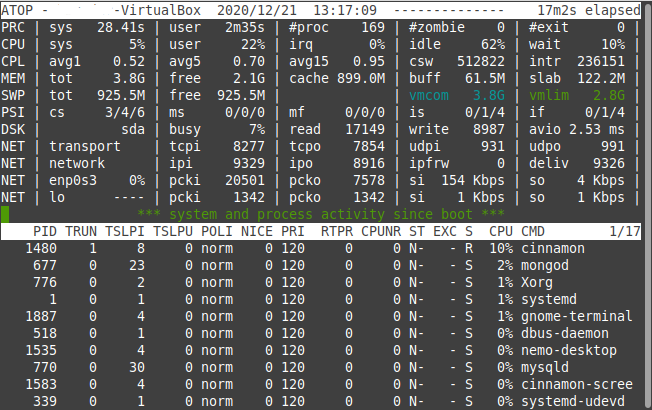
The scheduling info regarding our Linux Mint 20 system is shown in the image below:
Check the Individual Threads with the “atop” Utility
You can even view all the information regarding specific threads with the “atop” utility in the following manner:
The information regarding the individual threads on our Linux Mint 20 system is shown in the image below:
Conclusion
This article explained some of the most useful ways in which you can utilize the “atop” utility for analyzing your Linux mint 20 server’s performance. You can take a glance at all the performance metrics of your Linux server at once. Also, you can even view the individual performance-related statistics using this utility. All you have to do is to install it on your Linux Mint 20 system, check out its help pages to understand its usage, and then start using it right away.

