Massive Online Analytics (MOA) is a free to use open-source software tool that allows the users to work with data streams. Data streams are continuous packets of data that are broadcasted in real time to be used as they are received. What makes MOA special is that it is able to receive data streams as input and scale up the execution of an underlying algorithm to fit the needs of the incoming data.
MOA is widely used by the data science community to generate insights on data that is continuous in nature. It contains clustering, classification, regression, outlier detection, concept drift, and active learning algorithms that can use the incoming data streams to generate valuable inferences. These inferences can then be evaluated using the built-in evaluation algorithms.
Tools like MOA which comes with intuitive graphical user interfaces make it easy for everyone to create complex algorithms that are able to generate useful insights on data which would otherwise require coding in a programming language. MOA allows people from non-programming backgrounds to work with complex machine learning models and also enables them to get valuable results as outputs in different forms including graphs, tables, and charts.
Installation
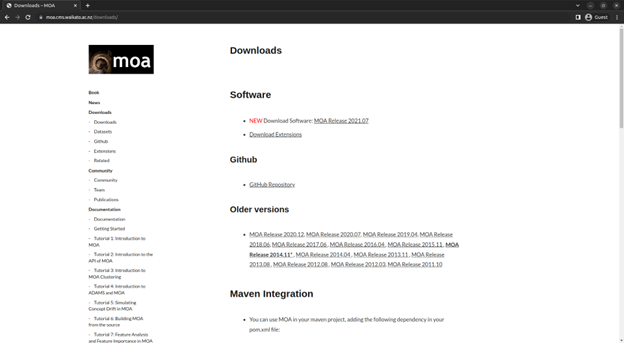
To install MOA on any Linux machine, we start with downloading the MOA file first.
1. Download the file from the MOA’s webpage.
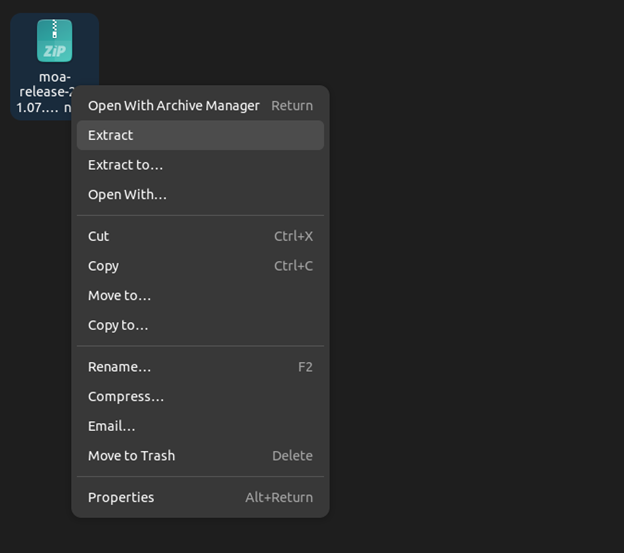
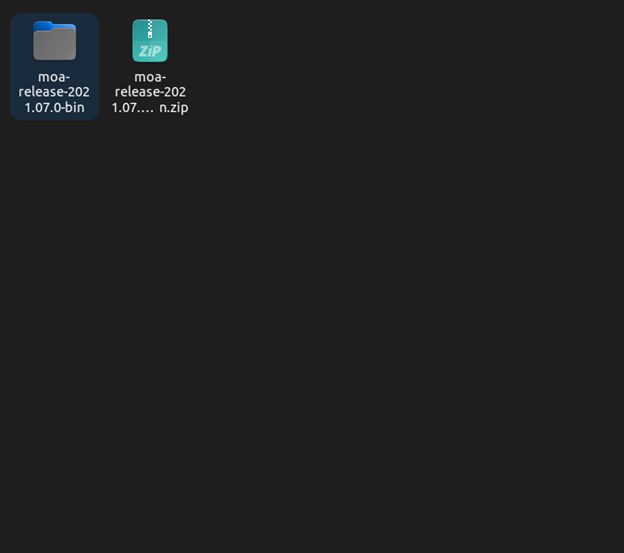
2. After the file has been downloaded, we extract the downloaded file and place it where we need it.
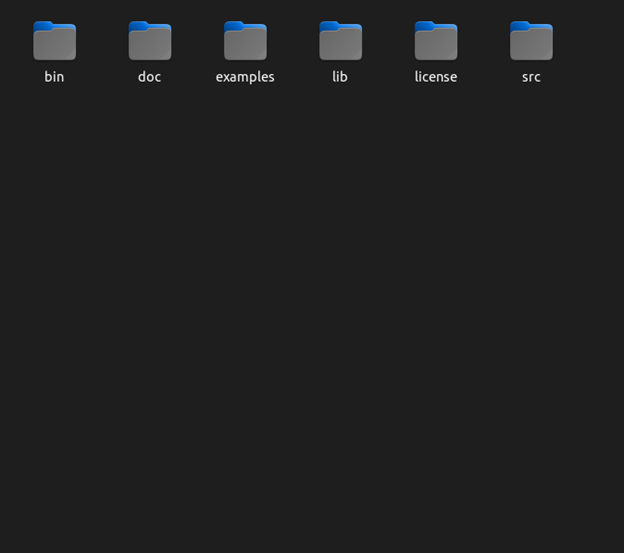
3. We now open the extracted folder and move into the root directory for MOA.
4. After moving to the root directory, we open a terminal instance here by right clicking and selecting the Open in Terminal option.
5. We now run the following command to execute MOA on any Linux machine:
You should get a terminal output which is similar to this:
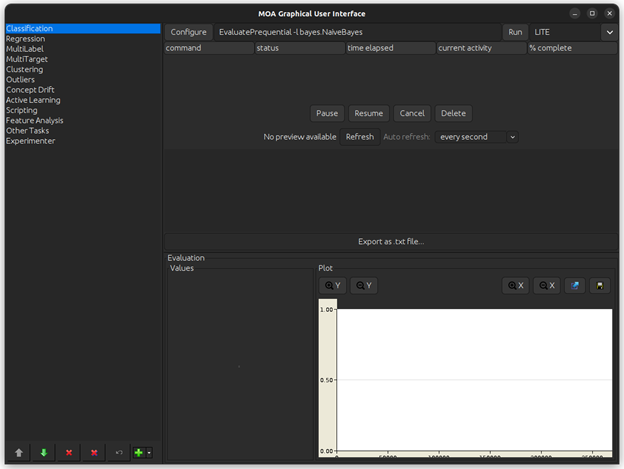
With this, an instance of MOA should start an execution on your Linux machine.
It looks something similar to this:
User Guide
With MOA now installed and ready to use on your Linux machine, you can start building your data analytics workflow.
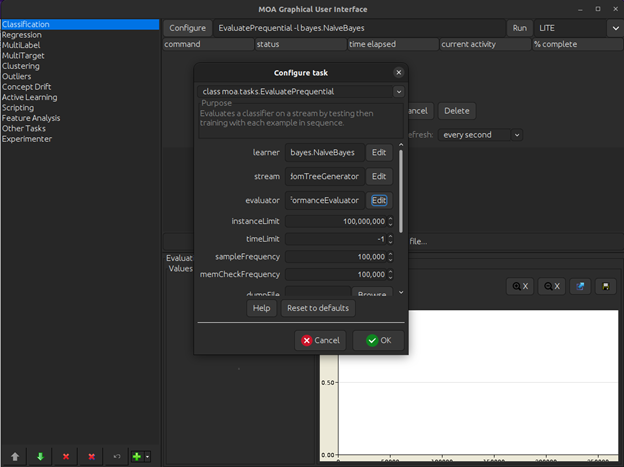
To begin, you have to click on the Configure option at the top of the MOA graphical user interface. This provides you with different categories and options that you can choose from and select based on what kind of data mining model does your specific application requires.
For this experiment, we create a Classification model by selecting the classification option on the left hand side.
The three main categories that you can change or rather choose are the Learner, Stream, and Evaluator.
Learner
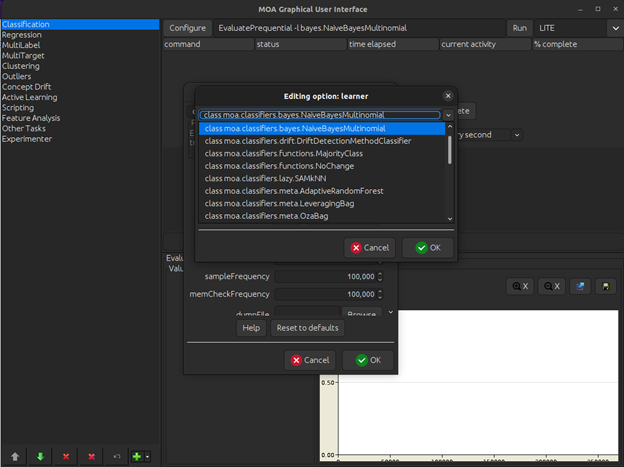
This specifies what kind of model you want your workflow to utilize for training on your data. There are multiple options to choose from, some of which are:
-
- NaiveBayes
- MultinomialNaiveBayes
- MajorityClass
- DriftDetectionMethodClassifier
For this experiment, we use the MultinomialNaiveBayes model.
Stream
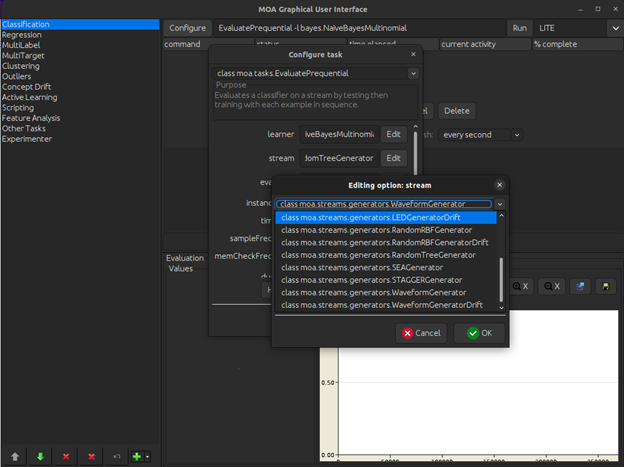
This specifies what kind of data instances we want our model to generate. There are multiple options to choose from which include:
-
- RandomTreeGenerator
- STAGGenerator
- SEAGenerator
- WaveformGenerator
This option depends specifically on the type of generated instances that your use case requires.
We use WaveformGenerator for this guide.
Evaluator
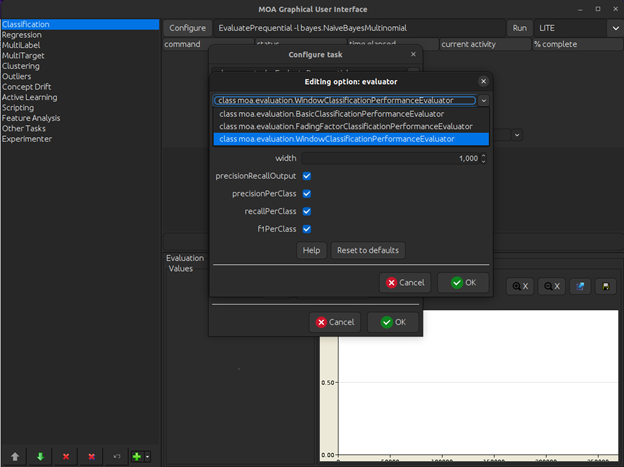
This specifies the kind of assessment that we want the generated outputs to go through. There are three main options to choose from in this category which include:
-
- BasicClassificationPerformanceEvaluator
- FadingFactorClassificationPerformanceEvaluator
- WindowClassificationPerformanceEvaluator
We use the WindowClassification evaluator with precision, recall, precision per class, recall per class, and f1 score per class all being output as result. These performance metrics help us better understand the class wise distribution and performance scores individually for our data.
There are other options after the three main model related options that we can also tweak. They include things like limiting the number of instances to the model and information regarding where to output the prediction results generated by the model. We will leave them to their default presets since they are not required for the purposes of this experiment.
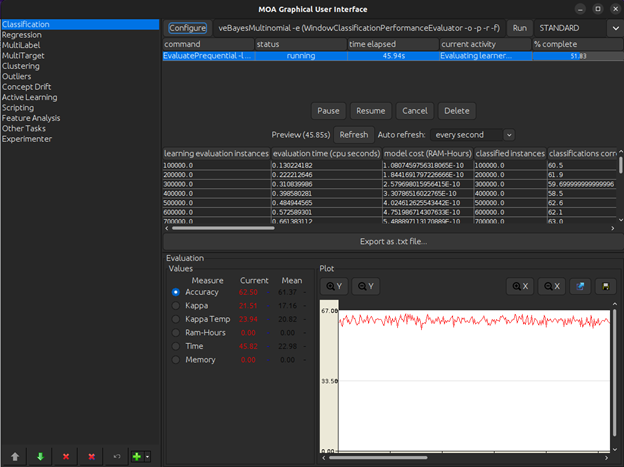
After we are done configuring the model to suit our exact needs, we click the Run option which essentially executes the model as it is. With continuous data being fed to it via data streams, it continues to run the iterations of the model as it continues to receive the data as input. With each iteration being run, the results it generates are outputted to the screen.
The following image shows the different results which the model has generated. These include categories like the number of instances that the model has trained over and the evaluation time that the cpu takes to generate the results on this data.
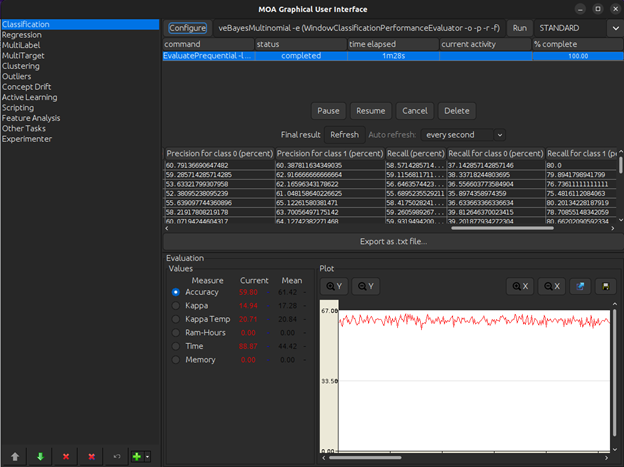
If we scroll further, we can see the class wise performance metrics being outputted. These performance metrics tell us the class wise precision, recall, and f1 scores. All of which are enabled during the configuration step in the model creation.
Conclusion
The world of data analytics has many tools that can be used to accomplish the data mining work flows. Some of them come with graphical user interfaces while others are strictly programming based. Massive Online Analytics is one such tool that uses an intuitive GUI. This helps people with little to no programming experience to also create and execute complex intelligent models that help them generate results on their data streams.
The key benefit of using MOA is that it enables the users to work with data streams. This means that real time data analysis algorithms can be created and utilized for certain use cases. As a result, this tool has become the go-to solution for most real time inference generation applications.

