Git provides several commands with the most fantastic features to perform different operations on the local repository. More specifically, the graph feature is one of the prettiest features of the “$ git log” command. This command generates a graphical overview of how the multiple development pipelines of the user are branched and merged over time.
This guide will explain how to generate pretty graphs for Git local branches.
How to Generate Pretty Git Branch Graphs?
Multiple commands are used to create a pretty graph in different scenarios, such as to view the graph for the desired local branch, including the time, without mentioning the time or textual representation of the graph of the required local branch. For this purpose, the “$ git log” command can be utilized to create pretty Git branch graphs along with different parameters, their value, and option.
Let’s move forward and execute the above-listed command to generate several pretty graphs!
Step 1: Navigate to Particular Git Repository
Utilize the below-stated command to move to the Git local repository:

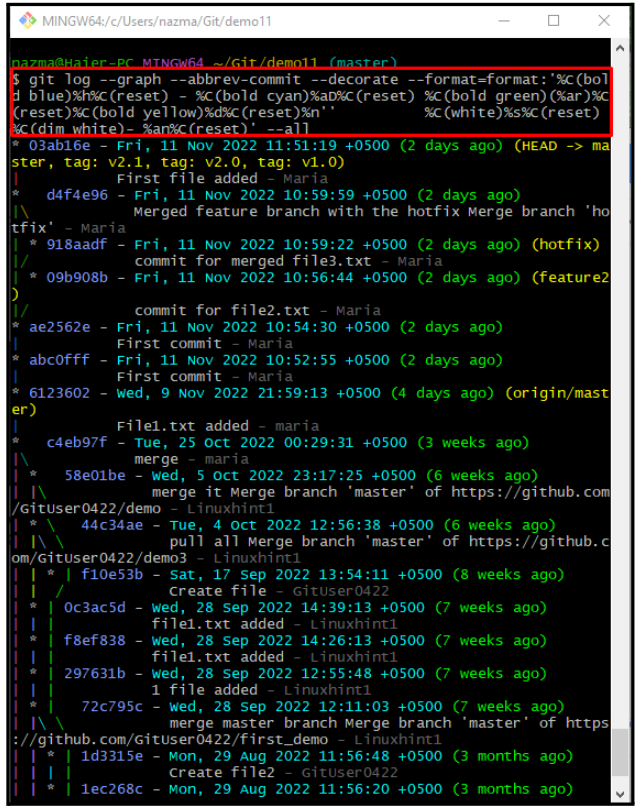
Step 2: Show Pretty Branch Graph Including Time
Now, run the below-listed command to view the pretty graph of the branch including with date, day, time, and commit message:
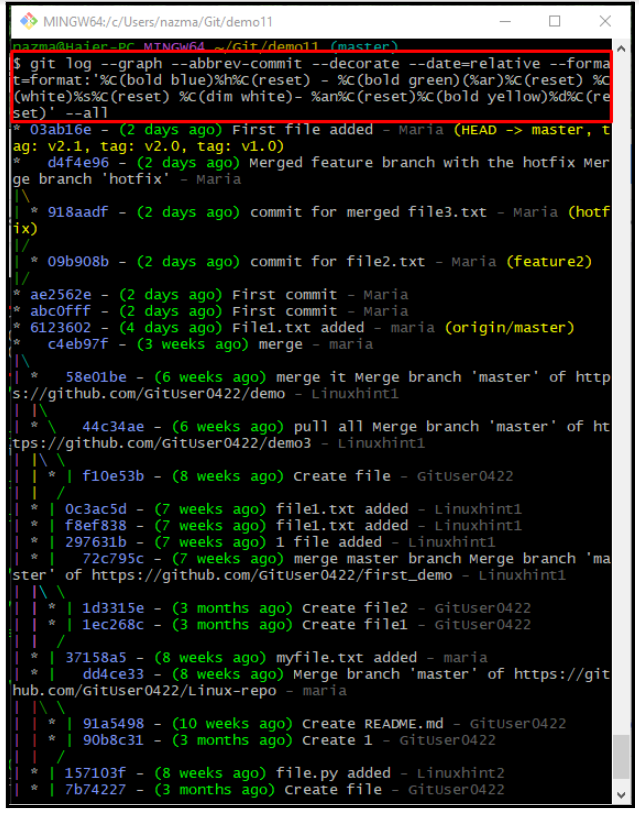
Step 3: Show Pretty Branch Graph Without Mentioning Time
To display the pretty graph with details excluding exact date, day, and time, run this command:
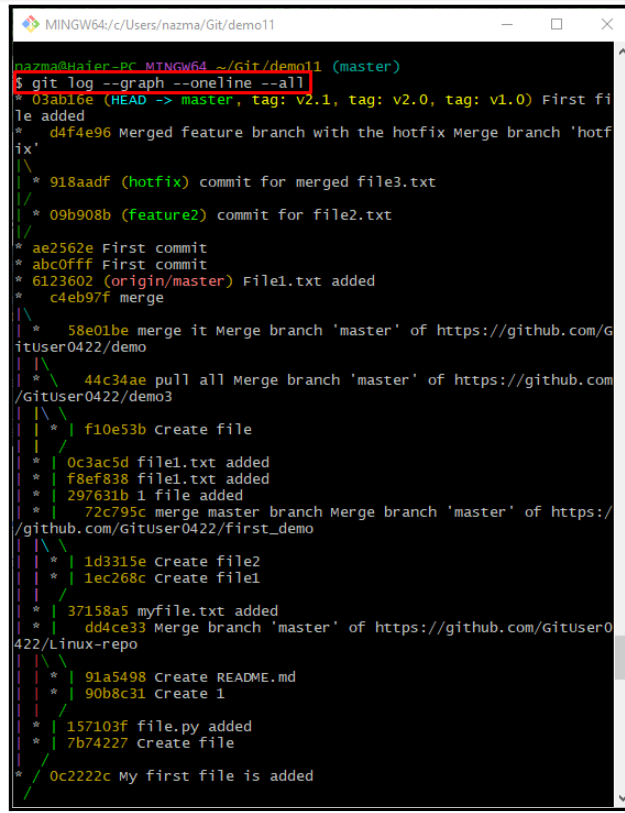
Step 4: Show Textual Graph Representation
Run the “git log –graph” command along with the “–oneline –all” parameter to view the textual output of the Git branch graph:
That’s it! We have provided the easiest way to view the pretty Git branch graphs.
Conclusion
Multiple commands are used to create a pretty graph of the Git particular branch, such as the “$ git log” command can be utilized to create pretty Git branch graphs along with different parameters, their value, and option. It permits you to view the pretty graph for the desired local branch, including the time, without mentioning the time or textual representation of the pretty graph of the required local branch. This guide demonstrated how to generate pretty graphs for Git local branches.


