
What Is a Pprof Package in Linux
The pprof package in the Linux operating system is a profiling tool that is used to write the runtime profiling data in the required format with the help of the pprof visualization tool. It serves via an HTTP server for the runtime profiling data, and it is mostly imported for the side effects of registering its HTTP handlers. All of the handle paths of the pprof command begin with the /debug/pprof/ followed by a certain command.
How to Install the Pprof Package for GO Profiling in the Ubuntu 22.04 System
If you are looking for a quick installation process of profiling in go, but everything is cumbersome, let us follow the following process. You need to follow some steps to install the pprof in the Ubuntu 22.04 system. Here are those steps:
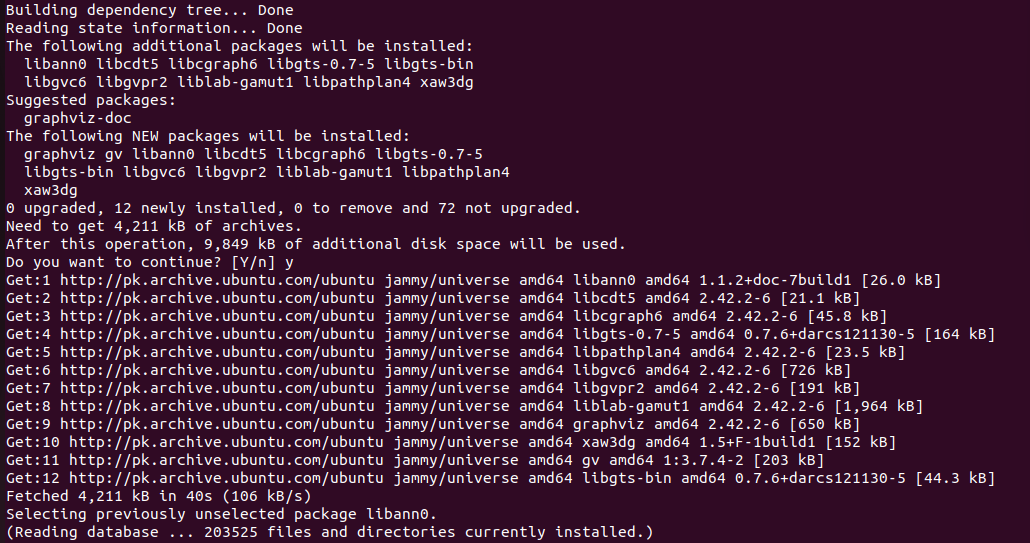
First, we need to install all the dependencies so that the pprof package does not end up at a halt. First, install the Graphviz dependency with the following command:
![]()
Make sure to use “sudo” to give the root privilege. Otherwise, the system might not allow you to install any package. See the following output:
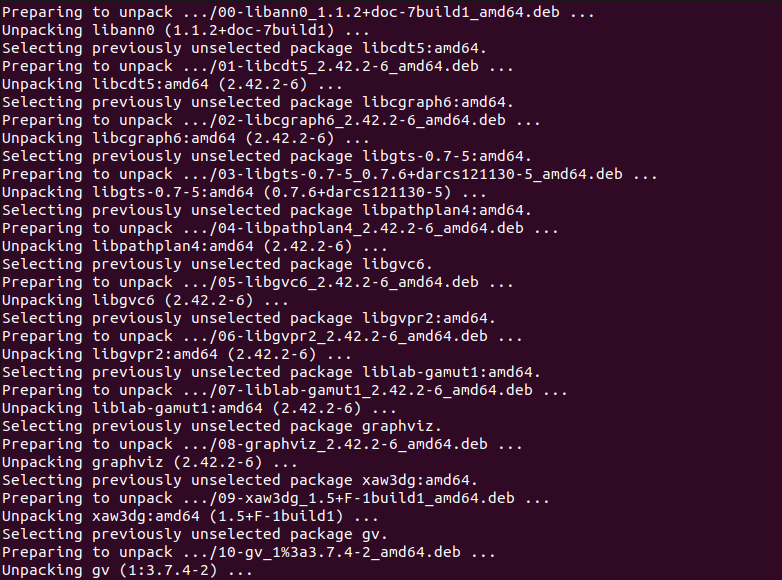
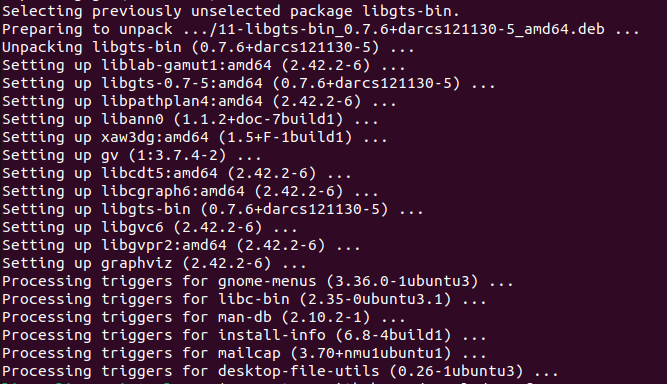
Now, the system has the dependencies for the pprof package. It allows you to install the pprof package. Use the “go get” command to get the pprof from GitHub. Here is the command:
![]()
If you do not have the “go” command preinstalled, you will have to specifically install it in order to use it. Our system did not have the “go” command installed, so we got the “command not found” result. See the following output:
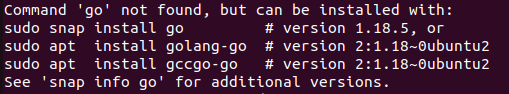
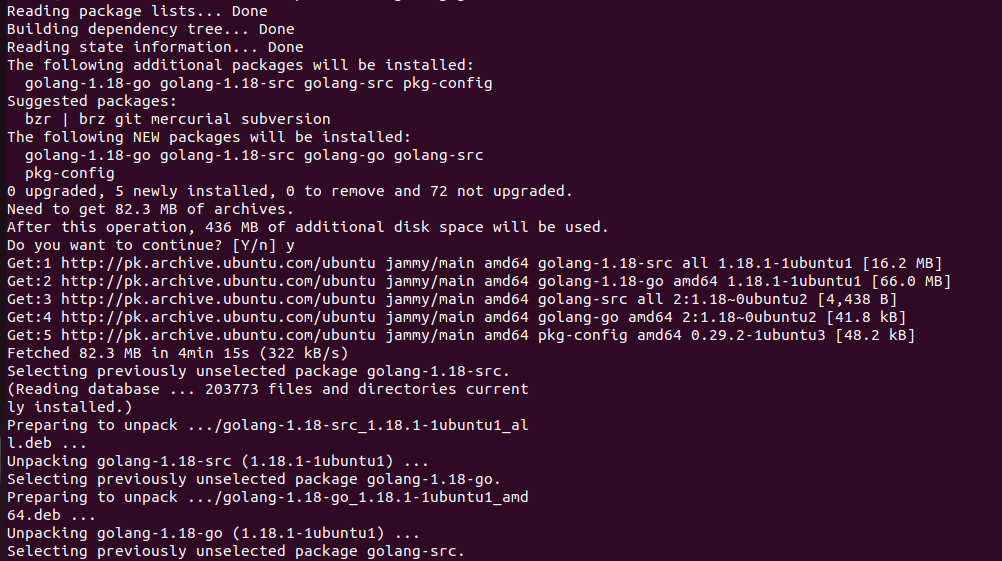
Install the “go” package first and then use it to get the pprof package from GitHub. As you can see in the previous screenshot, we have three different options to install the “go” package, so we can use any of them. All give the same result with slightly different features. However, we are using the “sudo apt install golang-go” command to install the “go” package version “2:1.18~0ubuntu2”. Execute the following command:
![]()
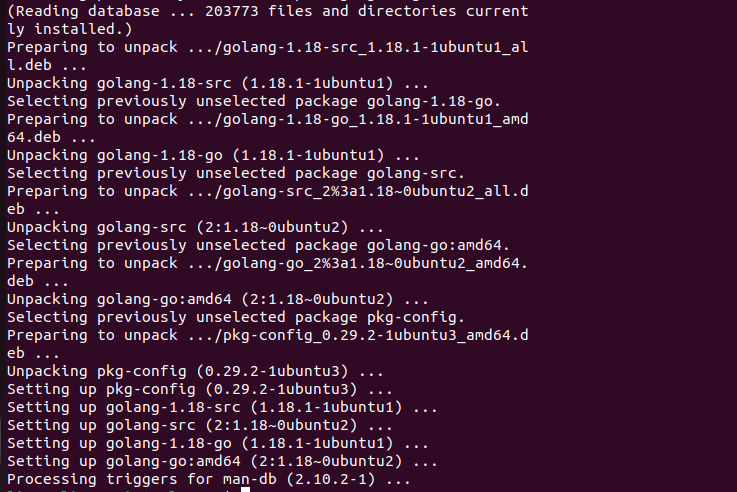
This allows you to install the “go” package as well as all of its dependencies and relevant libraries. See the following output:
Now, go to the GitHub repository and install the pprof package. A pprof package is a tool used for the analysis and visualization of the profiling data, but it is not an official google product. This is why you can utilize the GitHub repository and manually install the pprof package with the “go” command. Make sure that your system meets all the needs of prerequisites before you initiate the “go install github.com/google/pprof@latest” command. The prerequisites are a “go” development kit of a supported version and a graphviz application to generate the graphic visualization of the profiles. The Graphviz application is optional, so you can skip it if you want to. Since we installed both and prepared a platform for the pprof package, our system is ready to install it. Let us get an access to the GitHub repository to initiate the installation process. See the following command:
![]()
This command goes to the “github.com/google/pprof@latest” address. Install the pprof packages from the GitHub repository. See the following result:

The “go” command downloaded the package and it is installed in the Ubuntu 22.04 system successively. The binary is by default installed in the $HOME/go/bin location.
Display the Manual Page of Pprof
Now, check the manual page of the pprof to get the details of the pprof package. The manual page contains all the options for the pprof package with a brief detail of each. This allows you to get to know each option of the pprof and use them in your codes with ease. Moreover, whenever you need to, you can refer back to the manual page using the –help flag. Here is how you can do it:
![]()
This displays the complete manual page on your terminal. Have a look at the following:
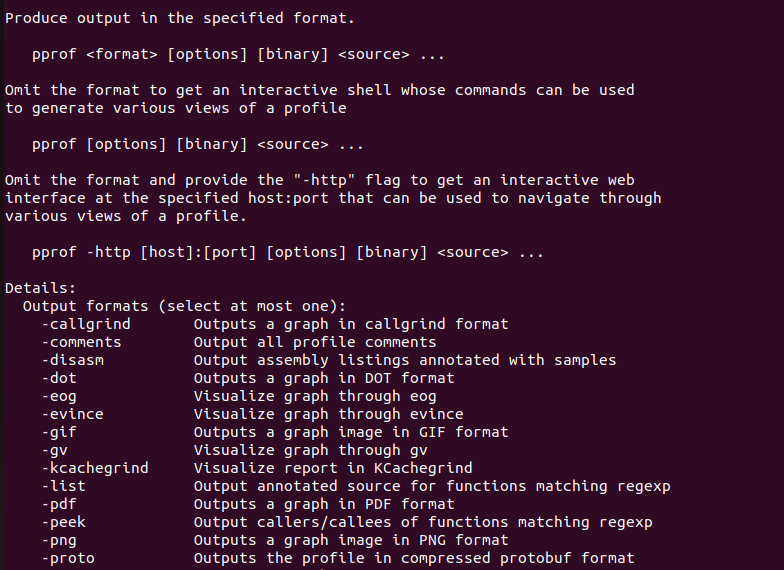
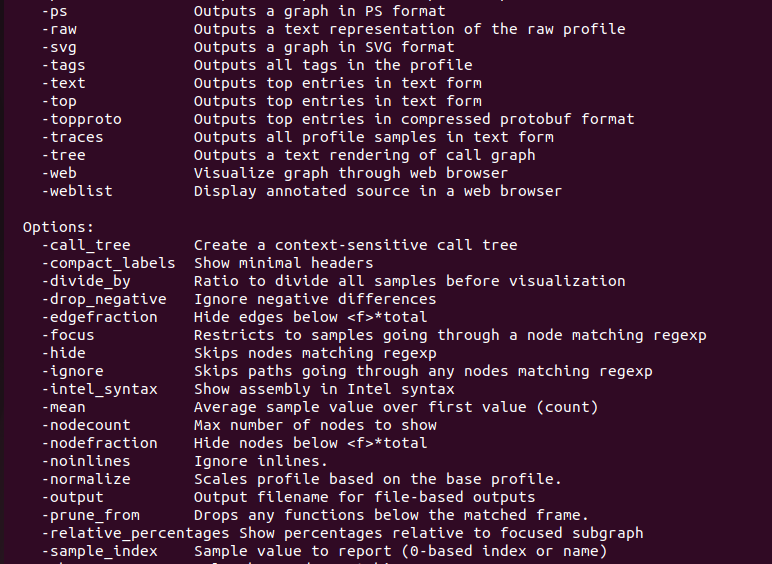
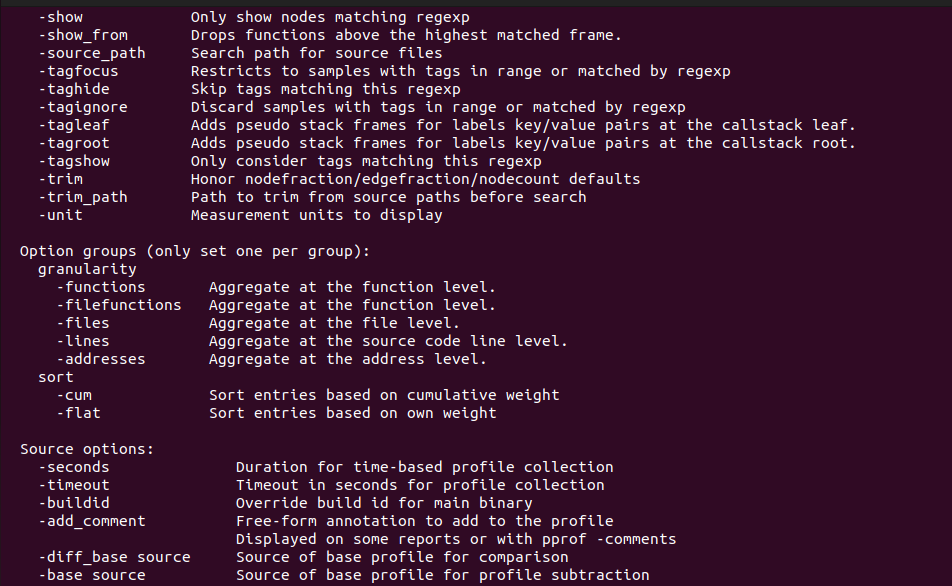
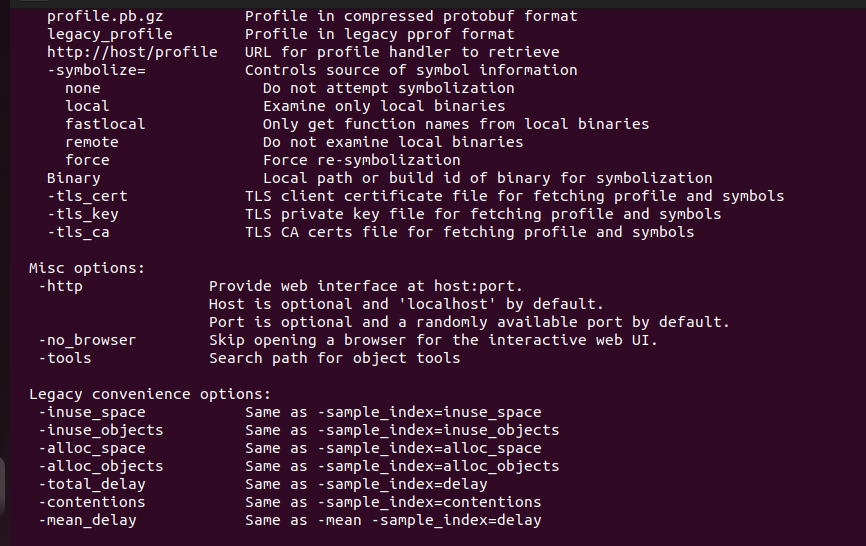
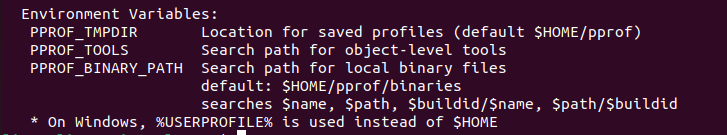
As you can see, there are many options available for the pprof command. You can use any of them to get the required formatted profiling data.
Use Pprof for Profiling the Data
To use the pprof in your program, import the pprof package first. Use the following command to import the pprof package:
![]()
Before you initiate the import, make sure that the application is already running an HTTP server. If you do not have any HTTP server application server running, you should start one by adding the “net/http” and “log” into the import and add the following code:

Now, you can use the pprof command to look at the heap profile. The following command is used to check the heap profile of the http://localhost:
![]()
This starts looking for the profile and tries to connect to the http server. See the following response:
![]()
By following the same procedure, you can look at a 30-second CPU profile, a goroutine blocking profile, holders of contended mutexes, etc.
Conclusion
This manual is a quick walkthrough of a pprof command used in the Ubuntu 22.04 operating system. We explored what the pprof command is in the Linux system. And we learned how to install it in our Ubuntu 22.04 system. We also learned about the variety of options available for the pprof package in the Linux operating system. The basic function of the pprof package is to serve via an HTTP server for the runtime profiling data while providing the profiled data in a required format through the pprof visualization tool. This allows you to profile GO in just 30 seconds.