Code optimization is a key aspect of coding and various programs help track the code performance. The software tools are referred to as profilers. If you are looking for one that is Linux-based, you have gprof at your disposal.
Working with Gprof Profiler
The gprof is a GNU profiler that measures the performance of a program. It measures the performance of programs written in Fortran, C++, Assembly, and C. The results generated by the Linux command help optimize the code for faster execution and efficiency by displaying the parts of the program consuming the most execution time.
To use the gprof command to analyze your program, you must compile it using the -pg option. First, let’s create a program to use for our example. Here, we create a C program, compile it, run the output with gprof, and then check the report generated by the gprof to see how the command performs.
Our program file is named demo1.c. To compile it using the gcc compiler, you must add the -pg options to add extra details to be used by the gprof. The command will be:
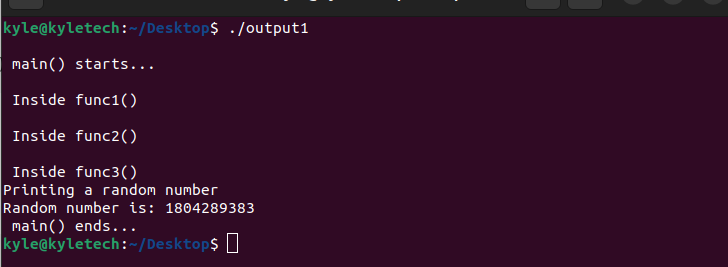
Our compiled output is output1 and once generated, we need to run it normally using the following command:
Running this executable generates the profiling data which, by default, is named gmon.out.
Gprof works with gmon.out to view all the details about the program.
Note that gprof takes two arguments: the compiled program and the gmon.out. The output report contains two sections: the flat-profile and the call-graph profile generation.
Analyzing the Output from the Gprof Profiler
1. Flat Profile
From the previous output, we can note the various section in the report.
The first thing to note is the various functions that the program had. In this case, we had the func3, func2, func1, and randomNum listed in the name section. The % time represents the running time of each of the functions. We see that the func3 took the longest time to run, implying that if we needed to optimize our program, that’s where we would start.
The calls represent the number of times that each of the functions is invoked. For each function, the time spent on each function per call gets represented in the self ms/call. Before reaching a specific function, you can also view the time spent on the function above it, the cumulative seconds, that adds the self second and the time spent on the previous functions.
The self seconds is the time spent on a specific function alone. The total ms/call is the time taken on a function including the time taken on its descendants for each call made to the function.
Using the previously given details, you can now optimize the performance of your program to see which part needs some redoing to reduce the time usage.
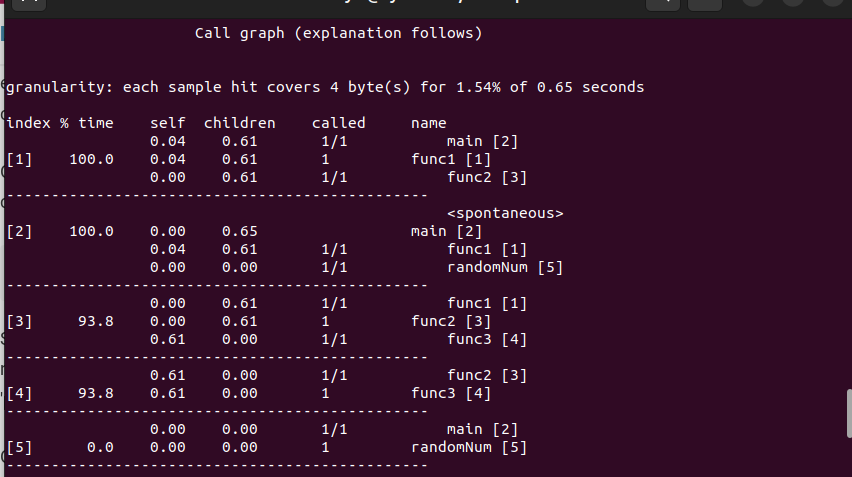
2. Call Graph
It is a table representing a function and its children.
The index lists the current function with which you can match the number to its name on the right.
The %time represents the time spent on a function and its children while the self is the time taken on the function excluding its children.
The best part with the call graph is that every detail is well represented and you can get more information about any results from the output displayed on your command line.
Conclusion
The bottom line is that when working with programs that use the gcc compiler, you can always check their execution speed to know how to best optimize them. We introduced what the gprof command is and what it does. Furthermore, we’ve seen a practical example of using it to give you an upper hand in optimizing your code.


