This guide covers an example wherein a C program checks its code coverage using the gcov Linux command.
How To Use gcov Command in Linux
A gcov command is a helpful tool, especially for developers, and it offers various benefits, including:
- Optimizing code performance
- Changing which parts of the code are slowing the programs
- Checking if the program causes memory leaks
- Checking if the program invokes the functions correctly
The gcov command is used with the executed files compiled using g++ or GCC. Therefore, the command works best with C or C++ programs. The program is compiled with specific flags to enable gcov to collect coverage data. Once compiled, various files get generated containing the notes files.
From there, you run the gcov command with the executable file to get the report of the data coverage.
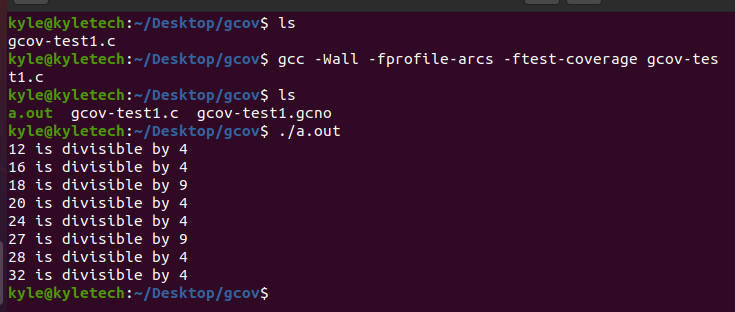
For example, we will use a C program that checks and prints out the numbers divisible by specific numbers within a given range. By default, the gcov command comes pre-installed. To compile your program, use the syntax below and replace the file name to match yours. For this example, our file is gcov-test1.c as shown below:
Once you compile your code, you should get various outputs like in the previous image. Compiling the code creates an instrumented executable that allows gcov to calculate the lines of code used. The -ftest-coverage enables gcov to calculate the lines of code executed. On the other hand, the -fprofile-arcs incorporates other conditionals, and you can run the instrumented executable, as shown with the following command. Our instrument executable is the a.out file, but if you specified an output file when compiling the code, you would have a different instrumented file.
The command runs the program and gives the expected output, which in our case is to list the divisible numbers within the set interval.
Once the code executes, the next thing is to check the code coverage using the gcov Linux command. Before that, you will note more files created. They contain the note files that gcov relies on to generate the report.
Here, you must add the program’s name as the argument to gcov in the following command:
Our output will be:
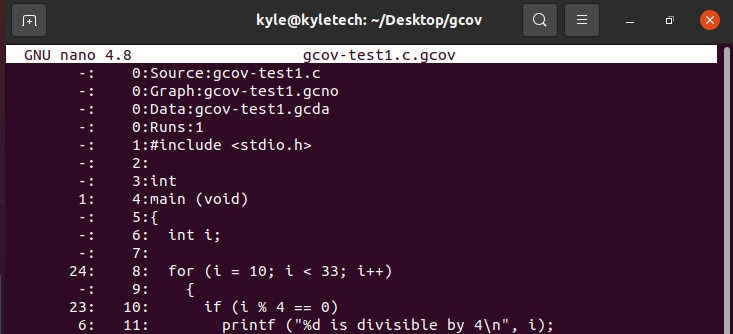
Note that all lines in our code got executed, meaning our code is well optimized. Furthermore, a new file gcov-test1.c.gcov was created. It contains the number of times each line in our program was executed, as shown in the image below. Any line not executed would have the ###### preceding it, and the number at the left shows the times the individual line was executed. Using these details, you can determine the changes to make to optimize your program and execute it faster.
If any lines are displayed as not executed using a debugger, you could fix that. The goal is to ensure all lines are executed to reach 100% and allow the code run faster.
Conclusion
This article covers checking your code coverage using the gcov Linux command. When coding programs, we write multiple lines, but not all are executed. Thus, knowing which lines execute and those that don’t is necessary. The information helps to either fix or remove those lines that are not executed, making the code faster and is a good way of optimizing your program.


