This guide covers how to use ltrace, and the installation and usage examples to get you started.
Installing ltrace in Linux
For Debian systems, ltrace gets installed using apt via the command below.

For RHEL or CentOS, the command is:
How to use ltrace
You can easily use ltrace with a program using the syntax below.
For instance, let’s create random files using the touch command and use ltrace to see how they behave.
It only returns an exit status of 0 to show that the files got created. Here, not much activity is taking place, but if we try creating an archive file where different dynamic calls are involved, we will get more details.
We will use the -f flag, which traces the child processes when they are created by the process. We begin by creating an archive file and then compressing it while tracing the child processes, as in the image below.
With ltrace, the -p option allows tracing the dynamic calls of a running process by using its process id.
In the example below, we use ltrace on a running process with an id of 47168.
The -r ltrace option displays the relative timestamp associated with each trace line. For instance, when using the cat command to create a file, we can use the -r option like in the output below.
The timestamp gets displayed below after the interrupt. Similar to the relative timestamp is the -t, which adds the time of day associated with each trace line. You can use -tt to include the microseconds.
In our case, we are running a simple ltrace process, but you can see that the time of the day gets displayed on the left.
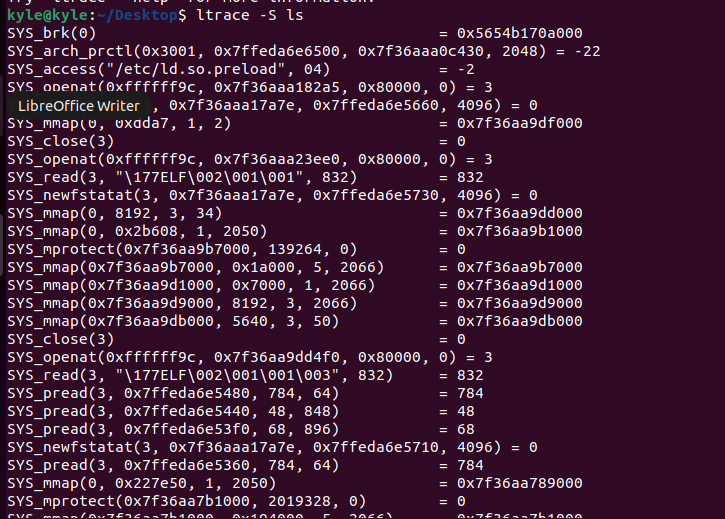
Use the -S flag to view the library and system calls associated with a process.
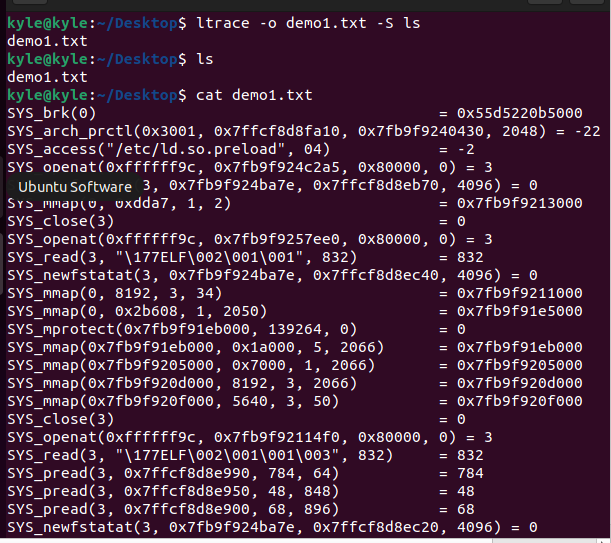
So far, we’ve seen how to use ltrace and display the results on standard error output. If you need to redirect the output to a file, the -o flag has got your back. For instance, to store the library and system calls retrieved in the example above into a file named demo1.txt, the command will be:
The file gets created once we run ltrace, and if we open it, we see the contents are similar to running the same command in the standard error output. Redirecting output to files is a good way of storing results for reference and keeping your terminal clean.
At times, you need to specify which library calls to use with ltrace. It is possible to do so using the -e option. You only need to use a chain of rules and specify the rules using patterns that identify either the library SONAMEs or the symbol names. You can see the manual page to understand more about working with a chain of rules and patterns, but the general syntax is as follows.
Replace the chain-rules with the pattern and add the program to intercept dynamic library calls; you should be good to go.
Wrap Up
The ltrace Linux command is great for intercepting and recording all dynamic library calls on your system. This guide covered the different ways to use ltrace using various examples. Using this guide, you can now easily work your way around ltrace.


