This guide offers an understanding of the pmstat Linux command using different examples to get you started and comfortable using the utility.”
How to Install pmstat in Linux
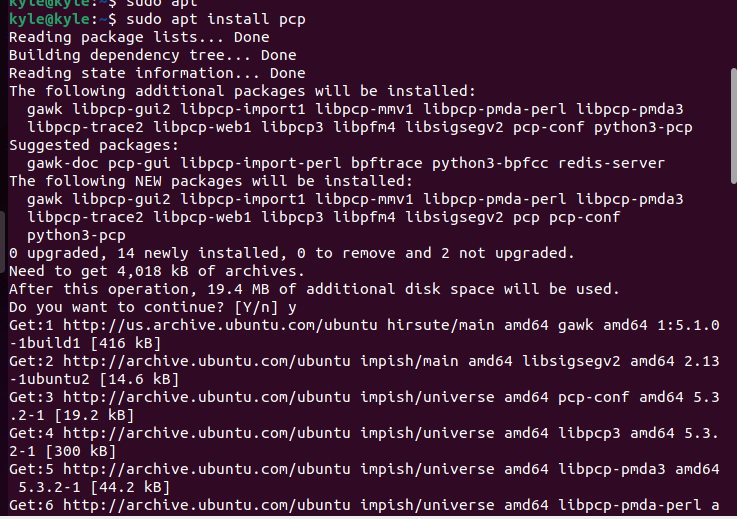
As noted, the pmstat Linux command is not standalone. It is part of the PCP, and its installation relies on installing the pcp package.
To install pcp, run the command below for Ubuntu.
Verify the installation by checking the pmstat or pcp version.
Checking System Performance Using pmstat
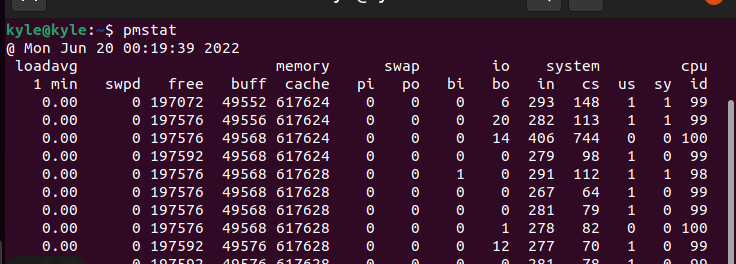
On your terminal, if you run the pmstat command with no arguments, you will get system performance results in a single line per given interval, which by default is 5 seconds.
Let’s analyze each of the fields to understand what they mean.
Remember, the performance results will show per line consecutively every 5 seconds, and you can terminate the program by pressing ctrl + c
- loadavg: it represents the 1minute load average
- memory: the memory section has different sub-fields. The first is the swpd which represents the average swap space used by your system between intervals, in our case, after every 5 seconds. The free is the average free memory within the set interval, represented in Kbytes. Next to it is the buff which is the average buffer memory used by the system within the interval. Lastly, the cache is the average cache memory represented in Kbytes and used per interval.
- swap: the swap displays the average pages paged-in (pi) and paged-out (po) and gets calculated per second within the set interval.
- io: it displays the average rate per second for each block input (bi) and block output (bo) during the interval.
- system: it represents the interrupt rate (in) and context switch rate (cs) during the interval.
- cpu: it represents the CPU time consumed in executing idle loop (id), system and interrupt code (sy), and user code (us).
Common pmstat Options
1. Setting Time Interval
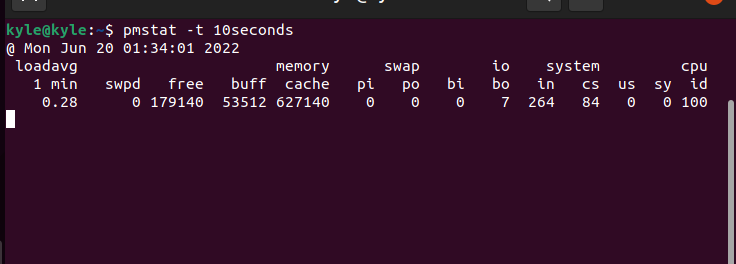
The default time interval is 5 seconds. However, you can use the -t option to specify a different time in seconds or hours. For instance, to set 10 seconds as the interval, the command would be:
To set hours as the interval, replace the seconds with the hour.
2. Setting Timezone
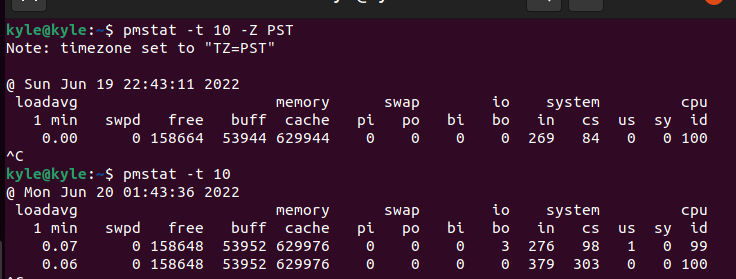
The timezone of the host is used by default to display the performance. If you need to use a different timezone, use the -Z followed by the timezone. For instance, to use the Pacific Standard Time, the command would be:
In the output above, the first command used the set timezone, which displayed the time and date on Sunday. However, the second output, which doesn’t take any timezone, uses the default one for the host machine, and you can note the difference in the timezone.
3. Specifying pmstat Metrics
The Performance Metrics Collector Daemon (PMCD) stores the metrics fetched by pmstat on the local host. To fetch the metrics from the PMDAs instead, use the -L flag. Alternatively, if you have a pcp archive log file on the system, use the -a followed by the path to the log file.
The syntax for this is:
Final Word
The pmstat command displays a high-level overview of the performance of a system. The command displays a single line output with different fields representing different metrics. To better utilize the tool, you should combine it with other pcp tools. We’ve covered an introduction of the pmstat Linux command, which is a scratch on its surface. For more details and usage, visit its main page.


