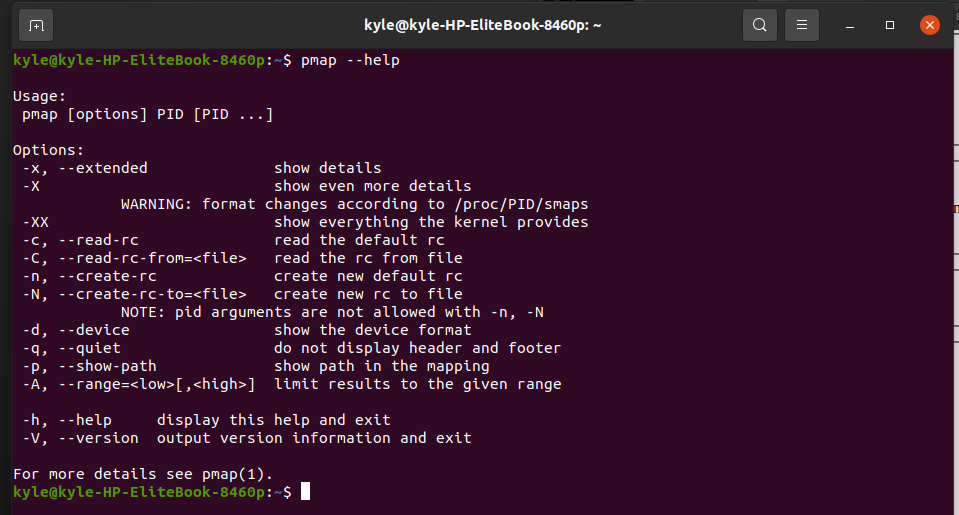
Processes running on an operating system get allocated to different regions that utilize a virtual memory space mapped to the physical memory in an abstraction layer. The kernel thus preserves a translation table highlighting each process, and any changes made get updated on the translation table. The pmap command is needed to access this memory space used by each process, and in this guide, you will learn how to use the pmap command to view the memory usage by a process.”
How to Use pmap
The syntax to use pmap is:
Therefore, the first thing to do is get the process ID of the particular process, and there are different ways to get the PID. To quickly get the PID of a process, use the ps aux, then grep the process name or use the pidof option.
For instance, to get the PID of the bash process:
1. Using ps aux
2. Using pidof

pmap to Get Memory Usage of a Single Process
Now that you have the PID of your target process, you can check its memory usage using the command below.
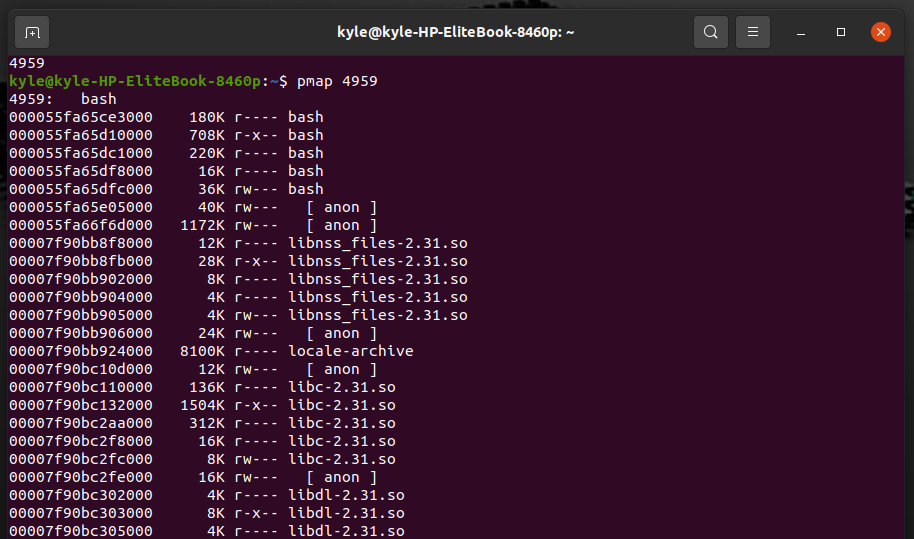
The output will be:
From the output, you can see that the first line highlights the process name, in this case, bash and its process ID. The next lines start with the mapped memory address, followed by the size of the memory of the particular memory address in kilobytes.
The other characters represent the permissions of the virtual memory, analyzed below.
r: implies that the process can read the mapped memory.
w: implies that the process can write to the mapped memory.
x: implies that the process can execute instructions in the mapped memory.
Using pmap to Get Memory Usage of Multiple Processes
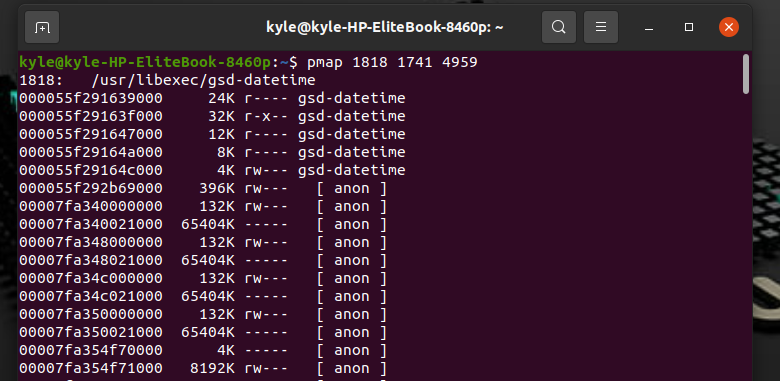
The pmap command gets used with multiple PIDs separated by a space to get their memory usage. For instance, if you have PIDs 1818, 1741, and 4959, the command will be:
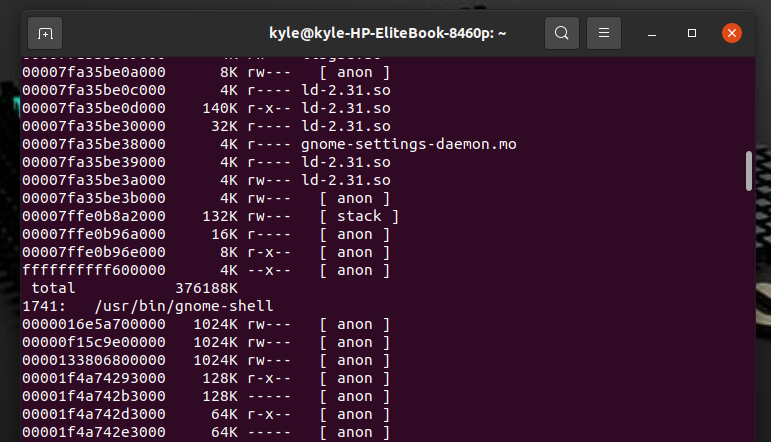
The output is similar to a single process, except that the memory usage will be separated per each process, as shown below.
For the output of the next process:
Getting an Extended pmap Output
To get an extended format of the memory usage, add -x to the pmap command as in the example below.
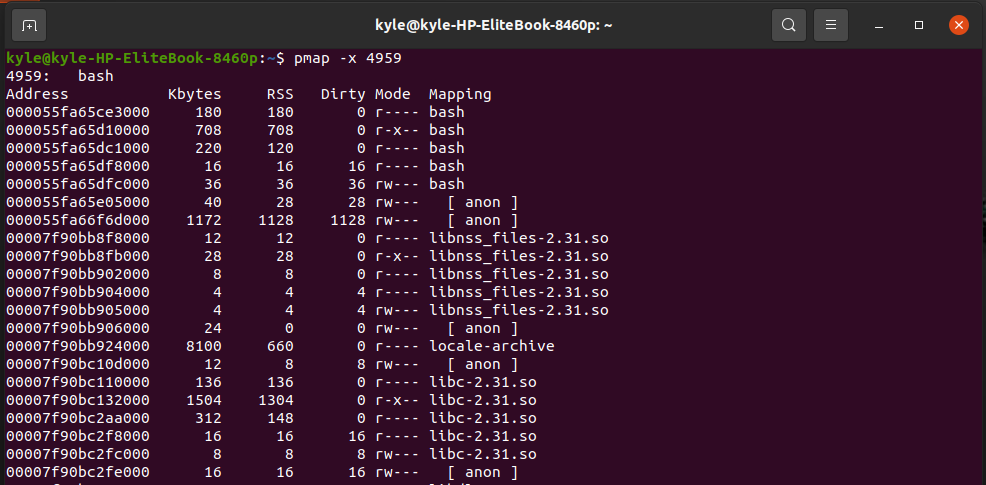
The extended output of the command will be:
You will note that some extra fields get displayed with the extended output. Each of the fields represents different memory usage information.
Address: It represents the starting address of the mapping.
Kbytes: this is the size of the virtual memory space.
RSS: this is the resident set size represented in kilobytes.
Dirty: the shared and private dirty pages expressed in kilobytes.
Mode: the map permissions.
Mapping: this is the file that backs the map, and it can be ‘[ stack ]’ or ‘[ anon ]’.
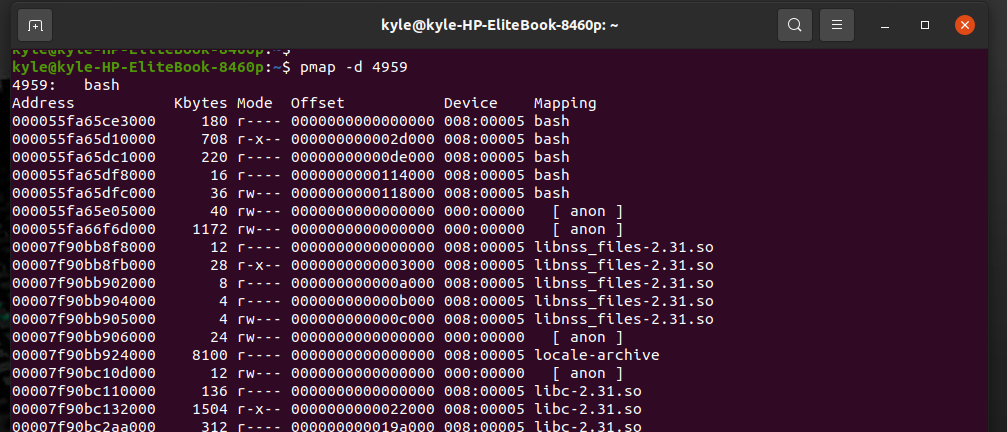
pmap Show Device Format
The -d option, when used with pmap, outputs the device format associated with the particular process.
Two more fields get added to the output.
Offset: it represents the offset of the file if the memory is file-based.
Device: the device format.
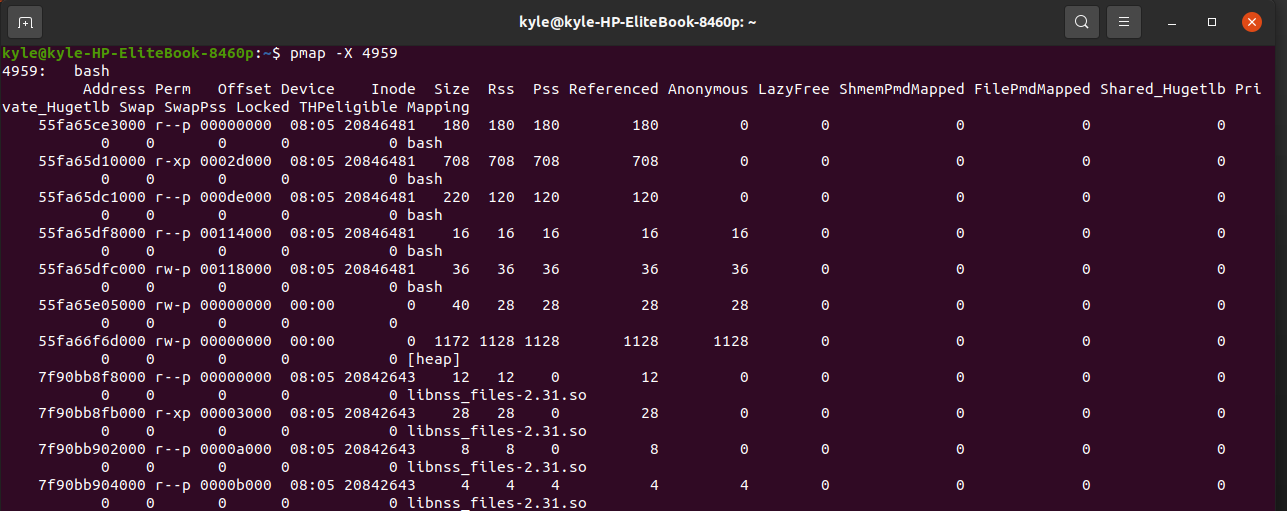
pmap Display Everything
The -x option displays the extended output. However, you can show everything the kernel can get about the memory usage of a process by adding the -X option.
Other pmap Options
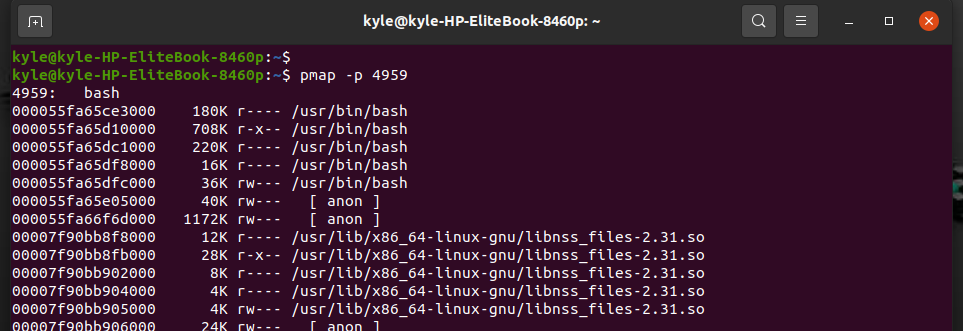
1. Get Full Path
To get the full path of the files:
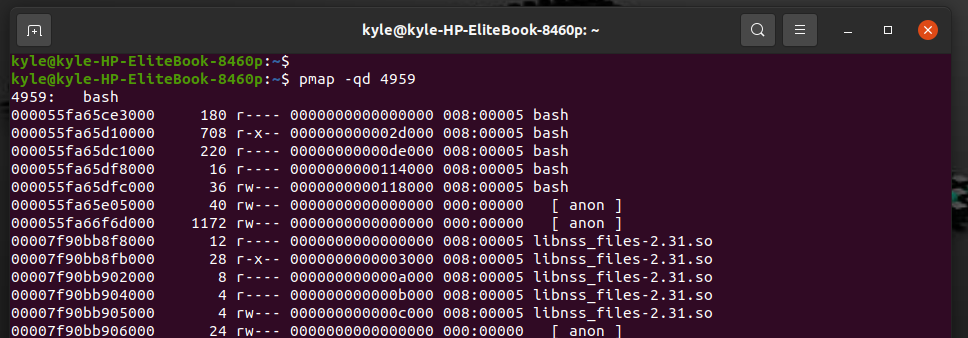
2. Ignore Column Names
If you want to exclude the column names when displaying the output report, for instance, when getting the device name:
3. Get the pmap Version
To see the current pmap version:
4. pmap Help Page
To open the pmap help page.
Conclusion
When working with Linux, understanding memory management can be complicated. Luckily, with the help of the pmap command, you can get the full picture of what goes on in memory. A pmap command is a great tool for anyone dealing with process memory maps. This guide covered the common usage of the pmap Linux command to get you started.


