Introduction to PromQL
The Prometheus monitoring system’s query language is called PromQL. It is made for creating a strong yet simple graph, alert, and derived time series queries (aka recording rules). PromQL is a brand-new query language for time series databases that has nothing in common with prior query languages, such as SQL in TimescaleDB, InfluxQL, or Flux.
When you first arrive in the exciting world of Prometheus, getting started with PromQL can be difficult. This tutorial will undoubtedly help you get started. Because Prometheus uses a time-series data model to store data, queries in a Prometheus server are different from SQL queries.
Learning how to construct good, performant PromQL queries starts with understanding how data is maintained in Prometheus.
Promql Data Types
Prometheus uses three data types for metrics: scalar, instant vector, and range vector. The scalar represents a floating-point value, which is Prometheus’s most basic data type. Scalars include numbers like 0, 18.12, and 1,000,000. In Prometheus, all calculations are done in floating-point.
The grouping scalars create an instant vector data type as a set of measurements at a single point in time. The result is an immediate vector when you execute a query that merely asks for the name of a metric, such as a bicycle distance meters total. Because metrics have both names and labels, a single name can have many values, so it’s a vector rather than a scalar.
The range vector is obtained by plotting an array of vectors across time. Neither Grafana nor the built-in Prometheus expression browser creates graphs directly from range vectors; instead, they employ instant vectors or scalars produced independently for distinct points in time.
Steps for Installing Prometheus Server on Ubuntu
All of the steps for understanding the Prometheus installation procedure on Ubuntu are detailed below.
Let’s begin by creating a user and group for the Prometheus system. You must type and run the following instruction:
Create a Prometheus system user and then, attach it to the primary group that is newly established.
To store its data, Prometheus will require a directory. The location of the directory is /var/lib/prometheus.
The primary configuration file directory for Prometheus is /etc/prometheus/. It will have different subdirectories.
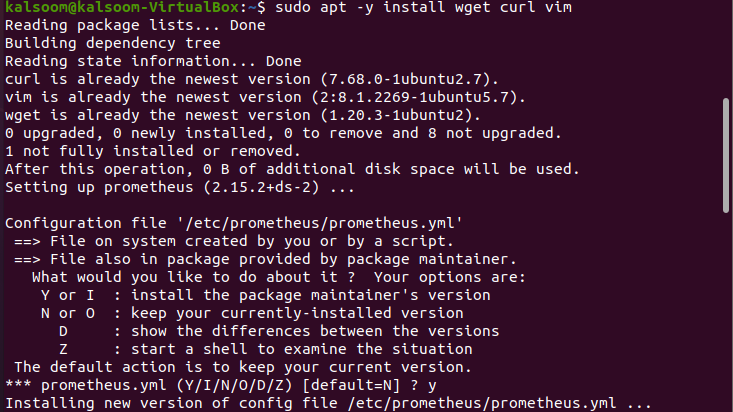
To access binary files, we must first download the most recent Prometheus archive and extract it. Install the wget program after that. The output is depicted in the affixed image:
Here, we have executed the install wget command to do so. The output is depicted in the affixed image:
Then, for Prometheus, download the most recent binary archive. The output is depicted in the affixed image:
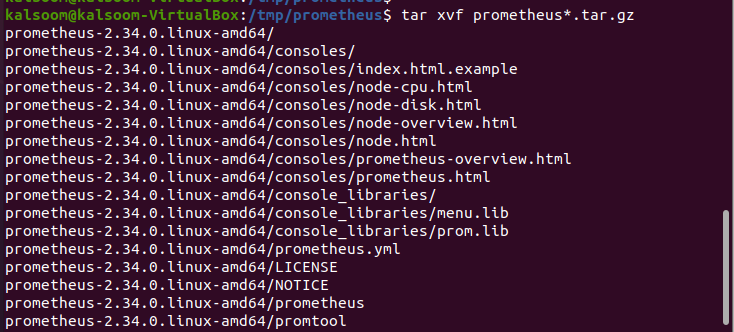
After that, you need to extract the file as follows. The output is depicted in the affixed image:
Now, transfer all the binary files to the directory located at /usr/local/bin/. See the given command in which we have specified the location. The output is depicted in the following image:
Verify the installed version by executing the attached command. The output is depicted in the affixed image:
In the /etc directory, you need to copy the Prometheus configuration template as we have done in the screenshot below:
This step requires moving the consoles, as well as console libraries. For that, type and run the command executed below:
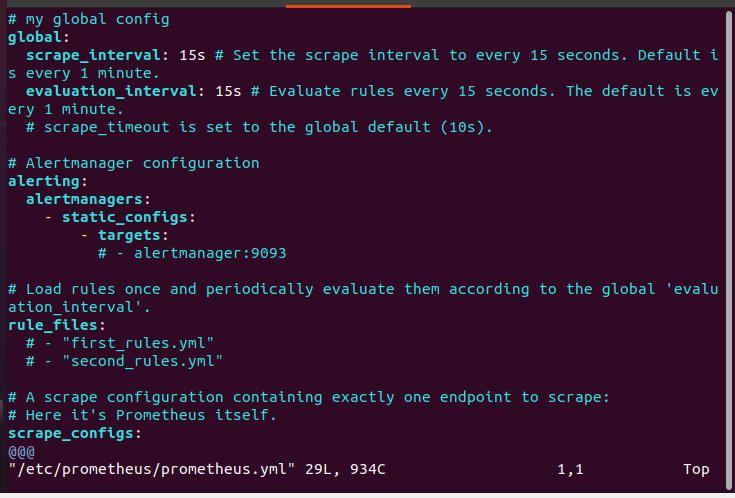
On Ubuntu 22.04/20.04/18.04, you must configure Prometheus. Now, create or update the /etc/prometheus/prometheus.yml configuration file for Prometheus.
The template settings should look something like affixed image. You can save the file after making any necessary changes. The output is depicted in the following image.
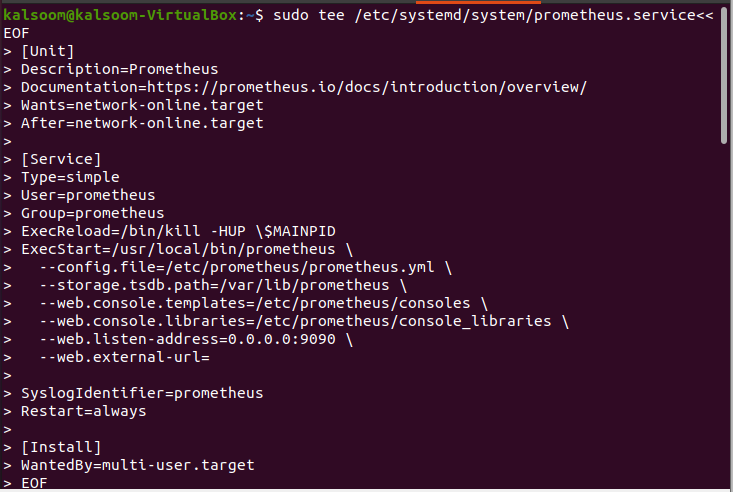
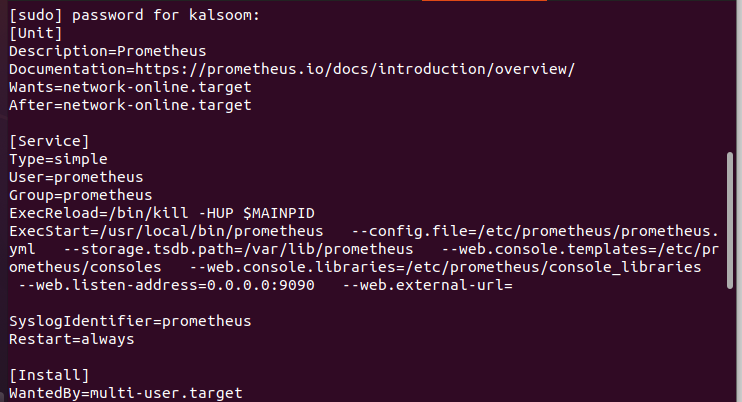
Now, you must now make a Prometheus systemd Service unit file. This unit file must be explicitly defined to administer the Prometheus service with systemd. The output is depicted in the affixed image:
Change the Prometheus user and group to own these directories. See the following three screenshots:
Now, let’s start the service by reloading the systemd daemon:
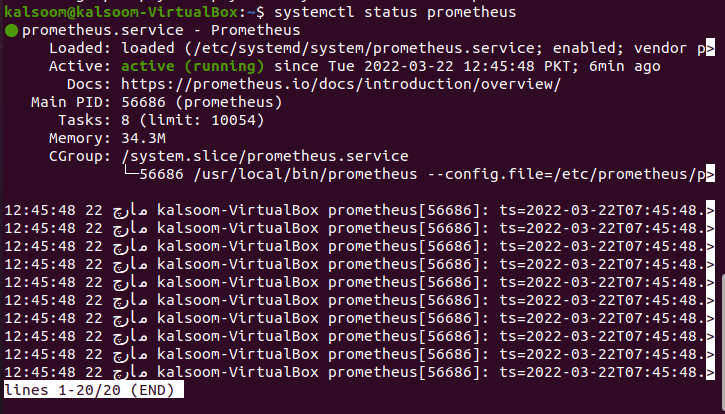
Run the “systemctl status prometheus” instruction to verify the status. The output is depicted in the affixed image:
You’ll need to open port 9090 if your server has a firewall service active. Refer to the following command. The output is depicted in the image provided.
In your relevant web browser, check the Prometheus server IP address to see if you can link to port 9090.
How to Access Prometheus From Web Interface?
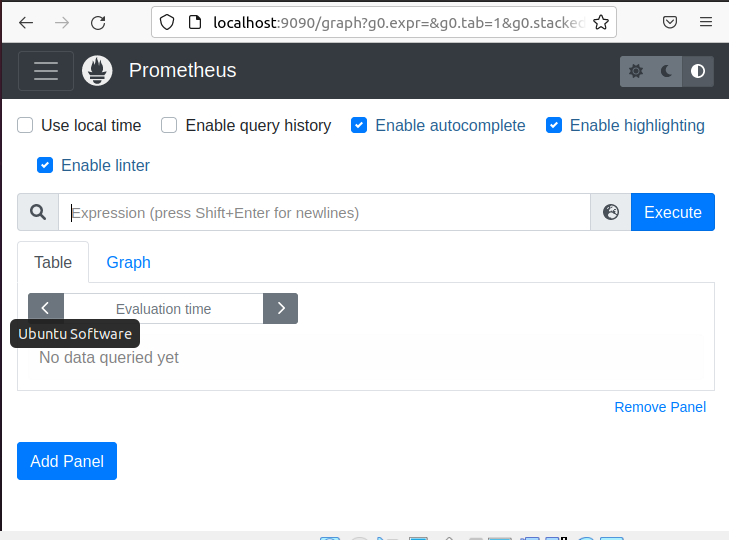
If your firewall (UFW) is up and functioning properly, open the Prometheus port. It connects on TCP port 9090 by default. Prometheus is now up and running and ready to take web requests. You can get to it by typing http://server-IP-or-Hostname:9090 into your browser.
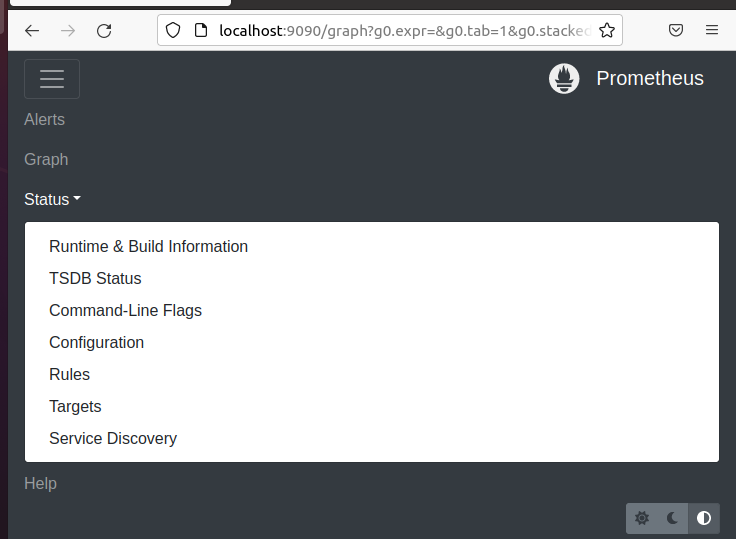
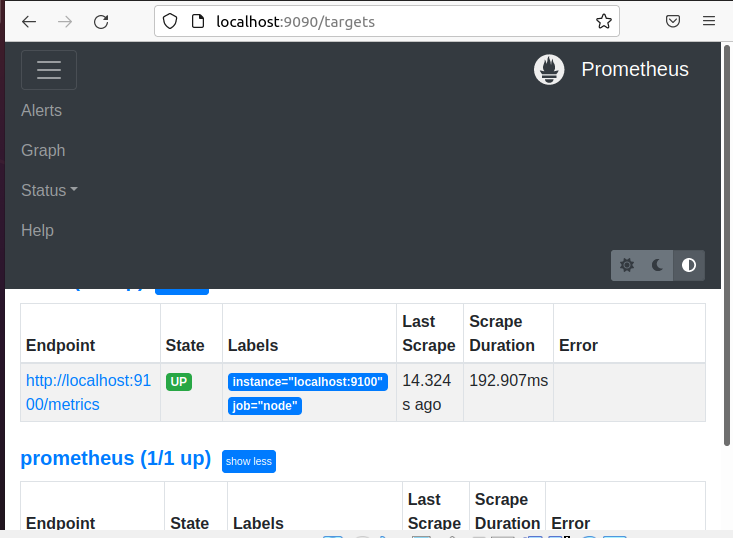
Navigate to Status if you want to get the information about configuration, status, rules, target, etc.
Here, we have clicked on Targets. This is done to verify the node’s status.
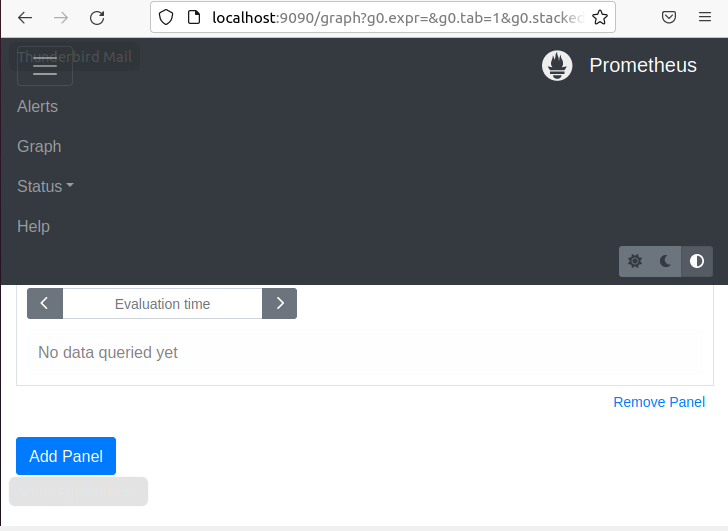
Now, you can use PromQL to extract interesting and actionable data from your Kubernetes cluster using a number of queries. These queries will provide information on node health, pod health, cluster resource use, etc.
We haven’t utilized any queries to pull relevant and actionable metrics from your Kubernetes cluster, as shown in the previous snapshot.
Conclusion:
PromQL, like any mature query language, is a broad and complicated subject. This post provided an overview of the ideas to help you get started constructing queries that return useful time series and metrics. You can follow all of the essential steps for installing the Prometheus Server listed. We hope you found this article helpful. Check the other Linux Hint articles for more tips and tutorials.


