Creating a Basic Line Plot
Before diving into multiple line plots, let’s first create a simple line plot using “Matplotlib”. In order to get started, let’s import the essential libraries and generate some sample data.
Example
In the following code, the “matplotlib.plot()” function is utilized to make a basic line plot:
import numpy
value1 = numpy.arange(0, 10, 0.1)
value2 = numpy.sin(value1)
plt.plot(value1, value2)
plt.show()
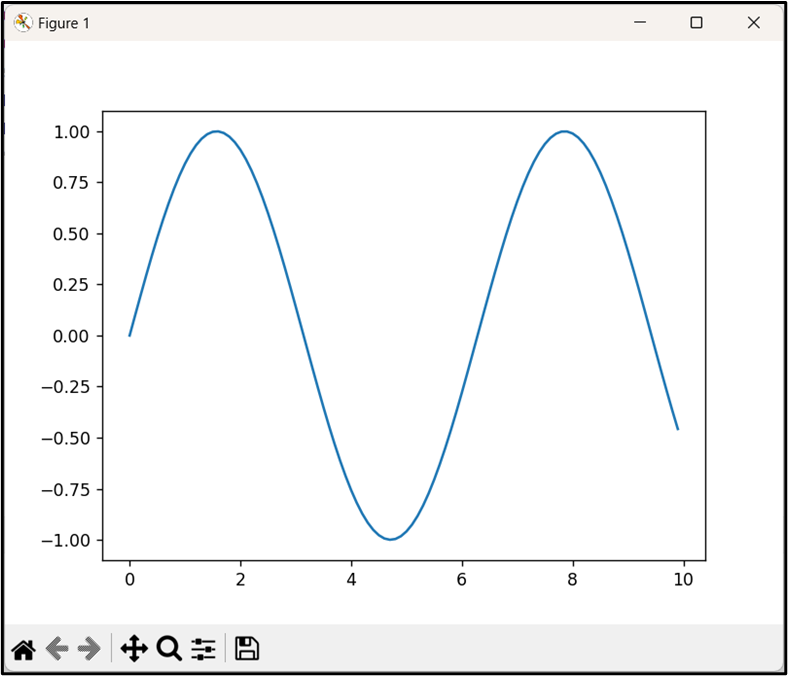
In the above code snippet, the “np.arange()” function is used to generate an array of values from “0” to “10” with a step of “0.1”. Similarly, the “np.sin()” function is used to calculate the sine of each value in the passed array. To create a basic line plot, pass the array and calculated sine of the array values as the “plt.plot()” function arguments, respectively.
Output
The above output implies that the basic line plot has been created.
Plotting Single Horizontal Lines
To plot a single horizontal line, the “plt.axhline()” function is used in Python.
Example
As an example, let’s look at the following code:
plt.axhline(y=2)
plt.show()
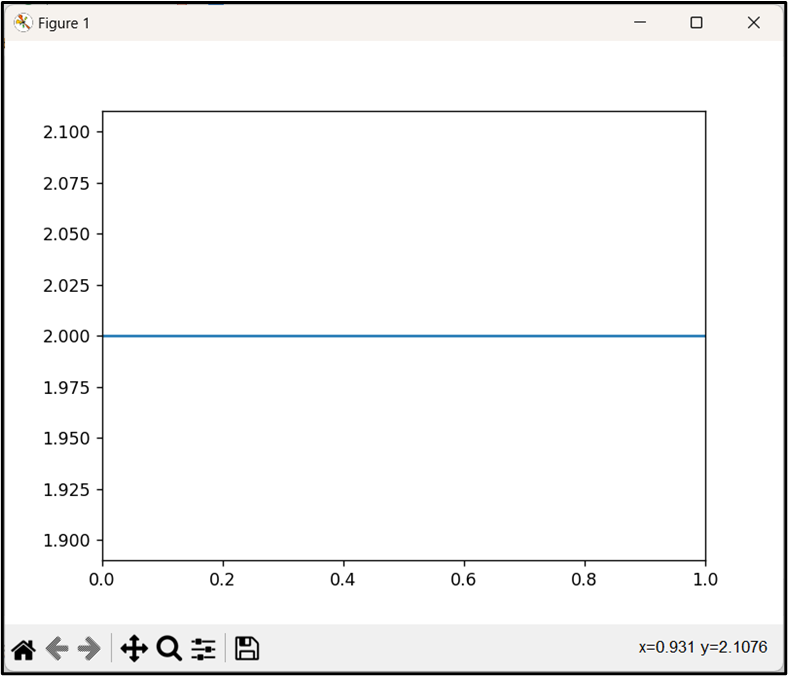
In the above lines of code, the “axhline()” function is used to plot a horizontal line at “y=2” on the current plot.
Output
In the above output, the single horizontal line has been plotted successfully.
Plotting Single Vertical Lines
To plot a single vertical line, the “plt.axvline()” function is used instead in Python.
Example
Let’s overview the following example code:
plt.axvline(x=2)
plt.show()
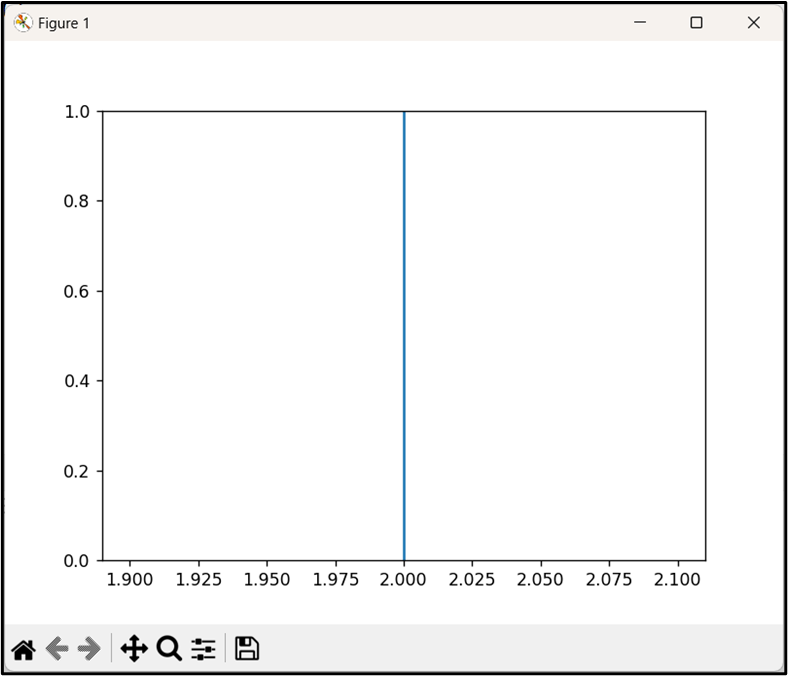
According to the above code block, the “plt.axvline()” function is used to plot a vertical line at “x=2” on the current plot.
Output
As analyzed, the single vertical line has been plotted appropriately.
Plotting Multiple Lines
To plot multiple lines, we simply pass multiple “x” and “y” arrays to the “plt.plot()” function.
Example
The code is summarized below:
import numpy
x = numpy.arange(0, 10, 0.1)
y1 = numpy.sin(x)
y2 = numpy.sin(2 * x)
plt.plot(x, y1)
plt.plot(x, y2)
plt.show()
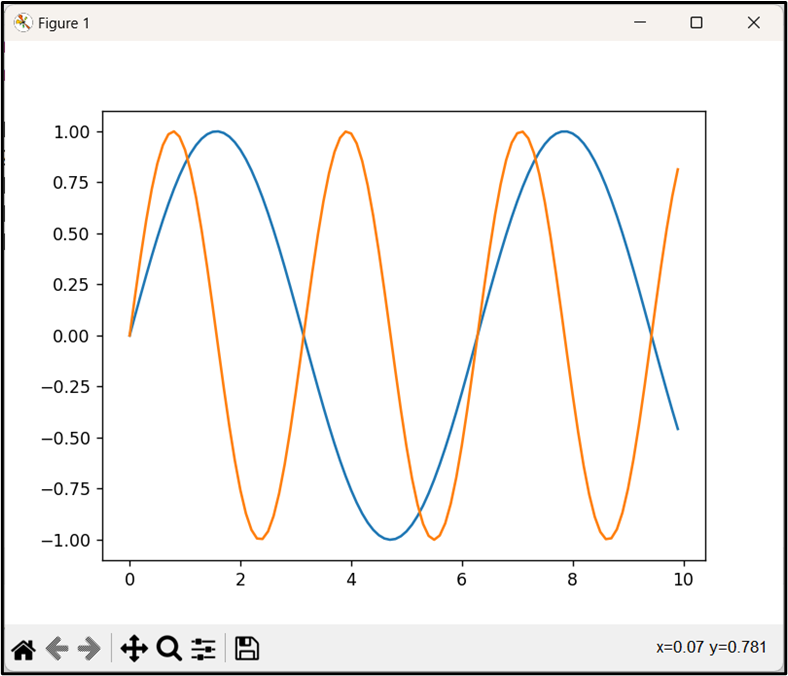
According to the above code, two arrays “y1” and “y2” are created with each representing a sine wave with a different frequency. The “plt.plot()” function takes the array with each of the sine waves separately as an argument and creates two lines in the same plot.
Output
Based on the above output, the two lines in the same plot have been generated successfully.
Plotting Multiple Lines by Customizing “linestyle” and “color” Arguments
In “Matplotlib”, by default, the plot is drawn with a solid blue line. The “linestyle” and “color” arguments can, however, be customized.
Example
The below code is used to plot multiple lines with customized line styles and colors:
import numpy
x = numpy.arange(0, 10, 0.1)
y1 = numpy.sin(x)
y2 = numpy.sin(2 * x)
plt.plot(x, y1, linestyle='--', color='red')
plt.plot(x, y2, linestyle=':', color='green')
plt.show()
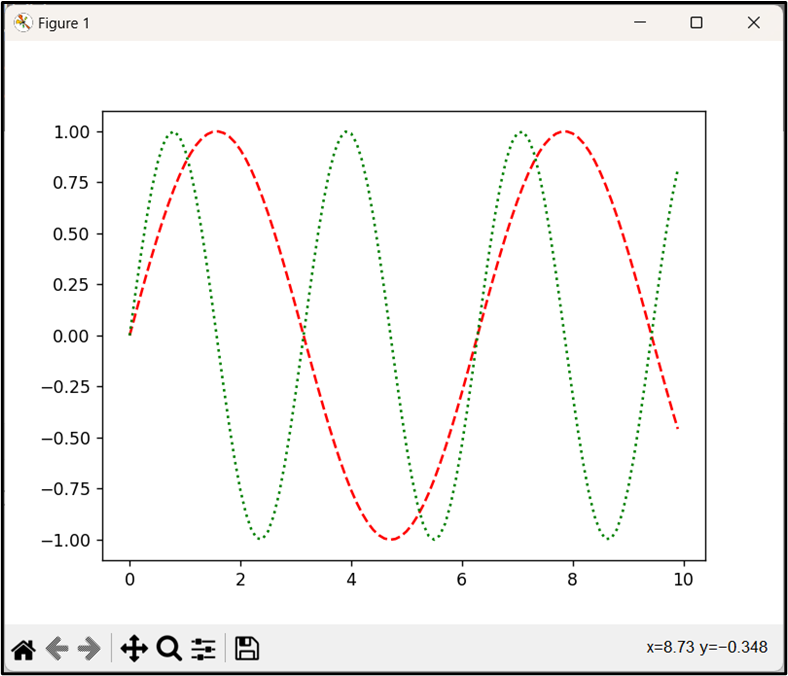
In the above code, the “linestyle” is set to ‘—‘ for the first line and ‘:‘ for the second one, giving us dashed and dotted lines, respectively. Also, the colors are also set to red and green for the first and second lines, accordingly.
Output
Based on the above output, multiple lines have been plotted via different line styles and colors.
Conclusion
“Matplotlib” provides functions such as “plt.plot()” to plot multiple lines on the same plot. These multiple-line plots can also be plotted using different line styles and colors with the help of the customized “linestyle” and “color” arguments. This post discussed various ways to plot multiple lines using numerous examples.

