PySpark – show()
It is used to display the top rows or the entire dataframe in a tabular format.
Syntax:
Where, dataframe is the input PySpark dataframe.
Parameters:
- n is the first optional parameter which represents integer value to get the top rows in the dataframe and n represents the number of top rows to be displayed. By default, it will display all rows from the dataframe
- Vertical parameter takes Boolean values which are used to display the dataframe in the vertical parameter when it is set to True. and display the dataframe in horizontal format when it is set to false. By default, it will display in horizontal format
- Truncate is used to get the number of characters from each value in the dataframe. It will take an integer as some characters to be displayed. By default, it will display all the characters.
Example 1:
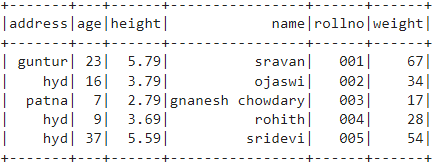
In this example, we are going to create a PySpark dataframe with 5 rows and 6 columns and going to display the dataframe by using the show() method without any parameters. So, this results in tabular dataframe by displaying all values in the dataframe
import pyspark
#import SparkSession for creating a session
from pyspark.sql import SparkSession
#create an app named linuxhint
spark_app = SparkSession.builder.appName('linuxhint').getOrCreate()
# create student data with 5 rows and 6 attributes
students =[
{'rollno':'001','name':'sravan','age':23,
'height':5.79,'weight':67,'address':'guntur'},
{'rollno':'002','name':'ojaswi','age':16,
'height':3.79,'weight':34,'address':'hyd'},
{'rollno':'003','name':'gnanesh chowdary','age':7,
'height':2.79,'weight':17, 'address':'patna'},
{'rollno':'004','name':'rohith','age':9,
'height':3.69,'weight':28,'address':'hyd'},
{'rollno':'005','name':'sridevi','age':37,
'height':5.59,'weight':54,'address':'hyd'}]
# create the dataframe
df = spark_app.createDataFrame( students)
# dataframe
df.show()
Output:
Example 2:
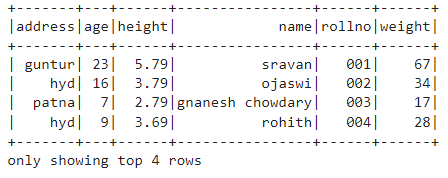
In this example, we are going to create a PySpark dataframe with 5 rows and 6 columns and going to display the dataframe by using the show() method with n parameter. We set the n value to 4 to display the top 4 rows from the dataframe. So, this results in a tabular dataframe by displaying 4 values in the dataframe.
import pyspark
#import SparkSession for creating a session
from pyspark.sql import SparkSession
#create an app named linuxhint
spark_app = SparkSession.builder.appName('linuxhint').getOrCreate()
# create student data with 5 rows and 6 attributes
students =[
{'rollno':'001','name':'sravan','age':23,
'height':5.79,'weight':67,'address':'guntur'},
{'rollno':'002','name':'ojaswi','age':16,
'height':3.79,'weight':34,'address':'hyd'},
{'rollno':'003','name':'gnanesh chowdary','age':7,
'height':2.79,'weight':17, 'address':'patna'},
{'rollno':'004','name':'rohith','age':9,
'height':3.69,'weight':28,'address':'hyd'},
{'rollno':'005','name':'sridevi','age':37,
'height':5.59,'weight':54,'address':'hyd'}]
# create the dataframe
df = spark_app.createDataFrame( students)
# get top 4 rows in the dataframe
df.show(4)
Output:
PySpark – collect()
Collect() method in PySpark is used to display the data present in dataframe row by row from top.
Syntax:
Example:
Let’s display the entire dataframe with collect() method
import pyspark
#import SparkSession for creating a session
from pyspark.sql import SparkSession
#create an app named linuxhint
spark_app = SparkSession.builder.appName('linuxhint').getOrCreate()
# create student data with 5 rows and 6 attributes
students =[
{'rollno':'001','name':'sravan','age':23,
'height':5.79,'weight':67,'address':'guntur'},
{'rollno':'002','name':'ojaswi','age':16,
'height':3.79,'weight':34,'address':'hyd'},
{'rollno':'003','name':'gnanesh chowdary','age':7,
'height':2.79,'weight':17, 'address':'patna'},
{'rollno':'004','name':'rohith','age':9,
'height':3.69,'weight':28,'address':'hyd'},
{'rollno':'005','name':'sridevi','age':37,
'height':5.59,'weight':54,'address':'hyd'}]
# create the dataframe
df = spark_app.createDataFrame( students)
# Display
df.collect()
Output:
Row(address='hyd', age=16, height=3.79, name='ojaswi', rollno='002', weight=34),
Row(address='patna', age=7, height=2.79, name='gnanesh chowdary', rollno='003', weight=17),
Row(address='hyd', age=9, height=3.69, name='rohith', rollno='004', weight=28),
Row(address='hyd', age=37, height=5.59, name='sridevi', rollno='005', weight=54)]
PySpark – take()
It is used to display the top rows or the entire dataframe.
Syntax:
Where, dataframe is the input PySpark dataframe.
Parameters:
n is the required parameter which represents integer value to get the top rows in the dataframe.
Example 1:
In this example, we are going to create a PySpark dataframe with 5 rows and 6 columns and going to display 3 rows from the dataframe by using the take() method. So, this results from the top 3 rows from the dataframe.
import pyspark
#import SparkSession for creating a session
from pyspark.sql import SparkSession
#create an app named linuxhint
spark_app = SparkSession.builder.appName('linuxhint').getOrCreate()
# create student data with 5 rows and 6 attributes
students =[
{'rollno':'001','name':'sravan','age':23,
'height':5.79,'weight':67,'address':'guntur'},
{'rollno':'002','name':'ojaswi','age':16,
'height':3.79,'weight':34,'address':'hyd'},
{'rollno':'003','name':'gnanesh chowdary','age':7,
'height':2.79,'weight':17, 'address':'patna'},
{'rollno':'004','name':'rohith','age':9,
'height':3.69,'weight':28,'address':'hyd'},
{'rollno':'005','name':'sridevi','age':37,
'height':5.59,'weight':54,'address':'hyd'}]
# create the dataframe
df = spark_app.createDataFrame( students)
# Display top 3 rows from the dataframe
df.take(3)
Output:
Row(address='hyd', age=16, height=3.79, name='ojaswi', rollno='002', weight=34),
Row(address='patna', age=7, height=2.79, name='gnanesh chowdary', rollno='003', weight=17)]
Example 2:
In this example, we are going to create a PySpark dataframe with 5 rows and 6 columns and going to display 3 rows from the dataframe by using the take() method. So, this results from the top 1 row from the dataframe.
import pyspark
#import SparkSession for creating a session
from pyspark.sql import SparkSession
#create an app named linuxhint
spark_app = SparkSession.builder.appName('linuxhint').getOrCreate()
# create student data with 5 rows and 6 attributes
students =[
{'rollno':'001','name':'sravan','age':23,
'height':5.79,'weight':67,'address':'guntur'},
{'rollno':'002','name':'ojaswi','age':16,
'height':3.79,'weight':34,'address':'hyd'},
{'rollno':'003','name':'gnanesh chowdary','age':7,
'height':2.79,'weight':17, 'address':'patna'},
{'rollno':'004','name':'rohith','age':9,
'height':3.69,'weight':28,'address':'hyd'},
{'rollno':'005','name':'sridevi','age':37,
'height':5.59,'weight':54,'address':'hyd'}]
# create the dataframe
df = spark_app.createDataFrame( students)
# Display top 1 row from the dataframe
df.take(1)
Output:
PySpark – first()
It is used to display the top rows or the entire dataframe.
Syntax:
Where, dataframe is the input PySpark dataframe.
Parameters:
- It will take no parameters.
Example:
In this example, we are going to create a PySpark dataframe with 5 rows and 6 columns and going to display 1 row from the dataframe by using the first() method. So, this results only first row.
import pyspark
#import SparkSession for creating a session
from pyspark.sql import SparkSession
#create an app named linuxhint
spark_app = SparkSession.builder.appName('linuxhint').getOrCreate()
# create student data with 5 rows and 6 attributes
students =[
{'rollno':'001','name':'sravan','age':23,
'height':5.79,'weight':67,'address':'guntur'},
{'rollno':'002','name':'ojaswi','age':16,
'height':3.79,'weight':34,'address':'hyd'},
{'rollno':'003','name':'gnanesh chowdary','age':7,
'height':2.79,'weight':17, 'address':'patna'},
{'rollno':'004','name':'rohith','age':9,
'height':3.69,'weight':28,'address':'hyd'},
{'rollno':'005','name':'sridevi','age':37,
'height':5.59,'weight':54,'address':'hyd'}]
# create the dataframe
df = spark_app.createDataFrame( students)
# Display top 1 row from the dataframe
df.first(1)
Output:
PySpark – head()
It is used to display the top rows or the entire dataframe.
Syntax:
Where, dataframe is the input PySpark dataframe.
Parameters:
n is the optional parameter which represents integer value to get the top rows in the dataframe and n represents the number of top rows to be displayed. By default, it will display first row from the dataframe, if n is not specified.
Example 1:
In this example, we are going to create a PySpark dataframe with 5 rows and 6 columns and going to display 3 rows from the dataframe by using the head() method. So, this results top 3 rows from the dataframe.
import pyspark
#import SparkSession for creating a session
from pyspark.sql import SparkSession
#create an app named linuxhint
spark_app = SparkSession.builder.appName('linuxhint').getOrCreate()
# create student data with 5 rows and 6 attributes
students =[
{'rollno':'001','name':'sravan','age':23,
'height':5.79,'weight':67,'address':'guntur'},
{'rollno':'002','name':'ojaswi','age':16,
'height':3.79,'weight':34,'address':'hyd'},
{'rollno':'003','name':'gnanesh chowdary','age':7,
'height':2.79,'weight':17, 'address':'patna'},
{'rollno':'004','name':'rohith','age':9,
'height':3.69,'weight':28,'address':'hyd'},
{'rollno':'005','name':'sridevi','age':37,
'height':5.59,'weight':54,'address':'hyd'}]
# create the dataframe
df = spark_app.createDataFrame( students)
# Display top 3 rows from the dataframe
df.head(3)
Output:
Row(address='hyd', age=16, height=3.79, name='ojaswi', rollno='002', weight=34),
Row(address='patna', age=7, height=2.79, name='gnanesh chowdary', rollno='003', weight=17)]
Example 2:
In this example, we are going to create a PySpark dataframe with 5 rows and 6 columns and going to display 1 row from the dataframe by using the head() method. So, this results to top 1 row from the dataframe.
import pyspark
#import SparkSession for creating a session
from pyspark.sql import SparkSession
#create an app named linuxhint
spark_app = SparkSession.builder.appName('linuxhint').getOrCreate()
# create student data with 5 rows and 6 attributes
students =[
{'rollno':'001','name':'sravan','age':23,
'height':5.79,'weight':67,'address':'guntur'},
{'rollno':'002','name':'ojaswi','age':16,
'height':3.79,'weight':34,'address':'hyd'},
{'rollno':'003','name':'gnanesh chowdary','age':7,
'height':2.79,'weight':17, 'address':'patna'},
{'rollno':'004','name':'rohith','age':9,
'height':3.69,'weight':28,'address':'hyd'},
{'rollno':'005','name':'sridevi','age':37,
'height':5.59,'weight':54,'address':'hyd'}]
# create the dataframe
df = spark_app.createDataFrame( students)
# Display top 1 row from the dataframe
df.head(1)
Output:
Conclusion
In this tutorial, we discussed how to get the top rows from the PySpark DataFrame using show(), collect(). take(), head() and first() methods. We noticed that show() method will return the top rows in a tabular format and the remaining methods will return row by row.


