Installing Wireshark on Debian 11
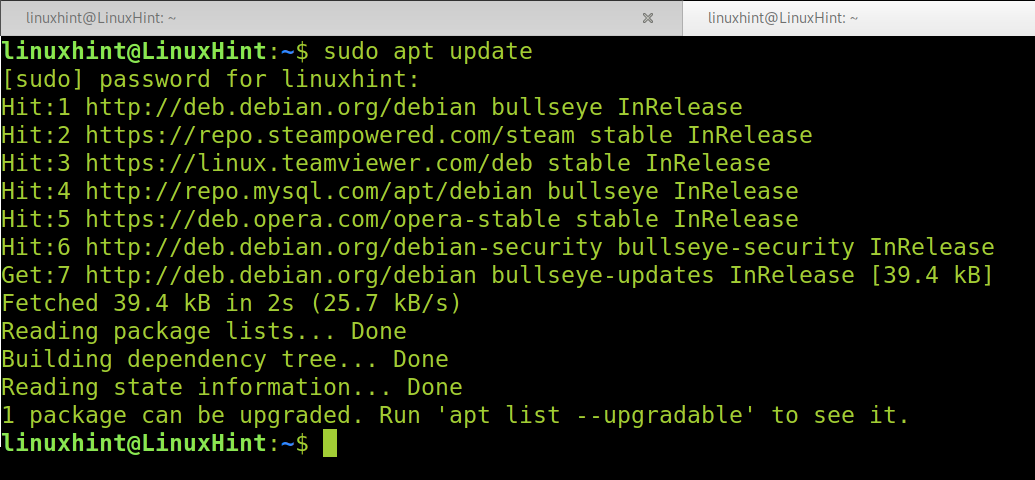
To Install Wireshark on Debian 11, run the following command to update your packet versions information.
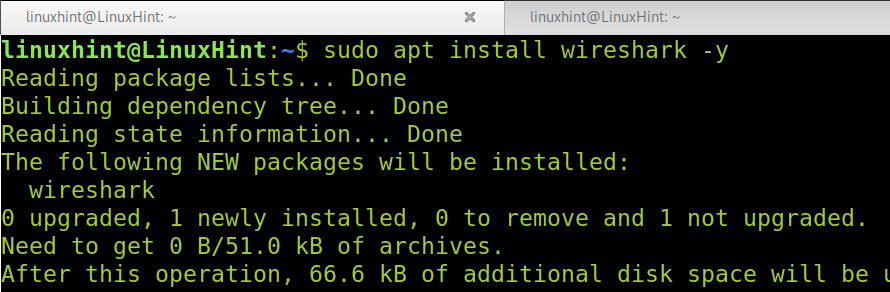
Then, install Wireshark using the apt command as shown below.
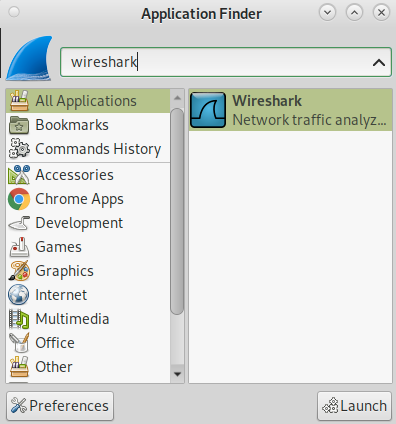
As you can see in the screenshot below, you can find Wireshark from your applications menu or Applications Finder. To get started with Wireshark, select it and press the Launch button.
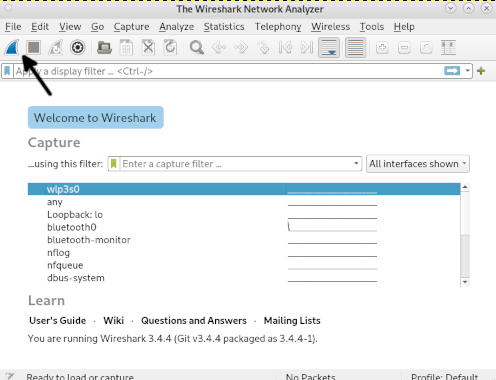
The welcome screen will show up. Select your network device to capture packets and press the shark fin icon shown in the screenshot below to start capturing network traffic.
Getting started with Wireshark
You can launch Wireshark from the graphical interface as explained in the previous steps, from the Application Finder or applications menu.
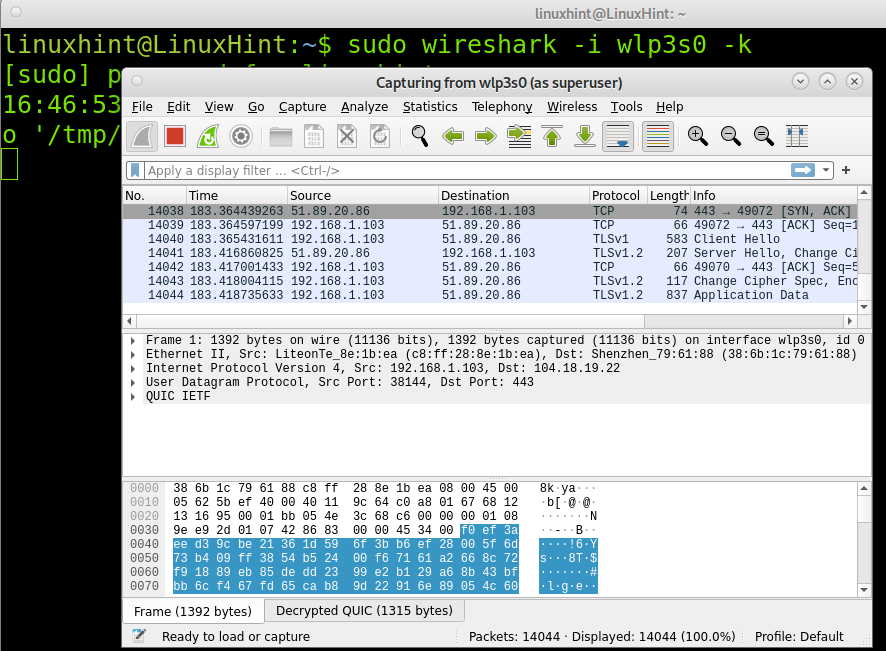
If you already know the network interface, you’ll use to monitor the network, you can launch Wireshark by running the following command, where <Device> must be replaced by the network device you are using. The screenshot below depicts Wireshark execution using the network interface named wlp3s0.
Note: You can find additional launching options at
https://www.wireshark.org/docs/wsug_html_chunked/ChCustCommandLine.html.
The Wireshark GUI
To begin understanding Wireshark, let’s divide the screen into 6 sections: Menu, toolbar, packet list pane, packet details pane and packet bytes pane. The following screenshot shows the location of each section.
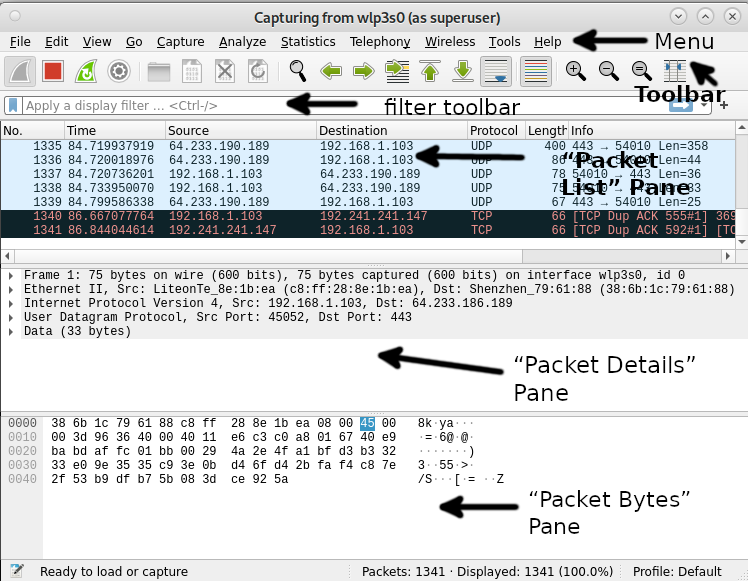
Where each section contains the following:
Menu: The menu section includes items to manage capture files, save, export and print partial or all captures. On the Edit tab this section contains options to find packets, manage configuration profiles and some preferences. The View tab allows to manage display options such as specific packet colorization, fonts, additional windows, and more. The Go tab allows you to inspect specific packets. The Capture tab allows to start and to stop capturing files, as well as editing filters. From the Analyze tab you can enable or disable protocol dissection, manipulate display filters, among additional options. The statistics tab allows to show statistics and summaries of captures. The telephony tabs allow you to display telephony statistics. The Wireless tab shows bluetooth and IEEE 802.11 statistics. The tools tab contains available tools for Wireshark. Finally the Help menu contains manual and help pages.
Toolbar: The main toolbar contains buttons to start, restart and stop capturing packets. From this toolbar you can save, reload and close capture files. From this menu you also can access additional capture options or find specific packets. You can pass to the next packet, or go back to the previous one. This toolbar includes display options to colorize packets, zoom in or zoom out, etc.
Filter Toolbar: This toolbar is useful to specify the type of packets you want to capture, or to specify the type of packets you want to drop. For example, to capture all packets whose source is the port 80, you can type “tcp src port 80”. To drop all arp packets you can type “not arp”
Packet List: The Packet List section displays packets in the capture file. The available columns show the number of packets in the file, the packet’s timestamp, the source and destination addresses, the protocol and packet length. The Info column shows additional information. If you select a packet in this section, more details on the specific packet will be shown in the “Packet Details” and “Packet Bytes” panes.
Packet Details: The Packets Details pane shows additional information on protocols, including response time, TCP analysis, checksum and IP geolocation. This pane also will show if there are links or a relationship between different packets.
Packet Bytes: This pane displays hex dump of packets, including data offset, sixteen ASCII bytes, sixteen hexadecimal bytes.
Capturing Packets with Wireshark
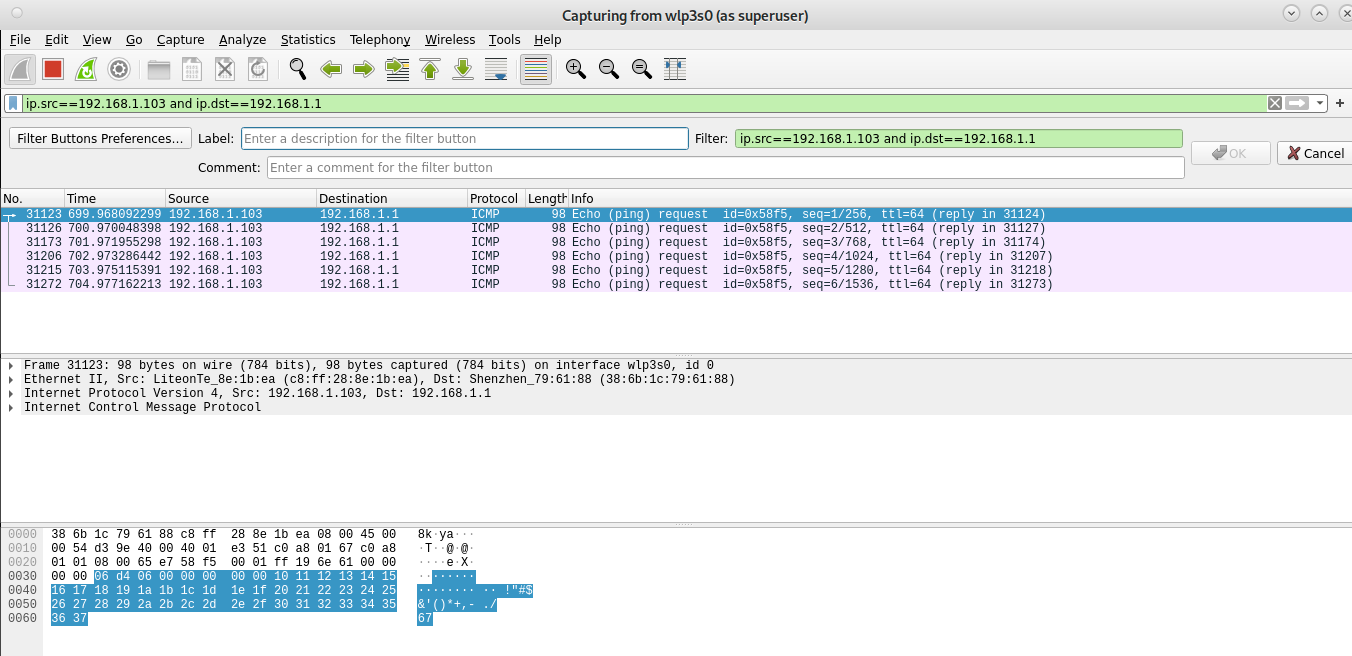
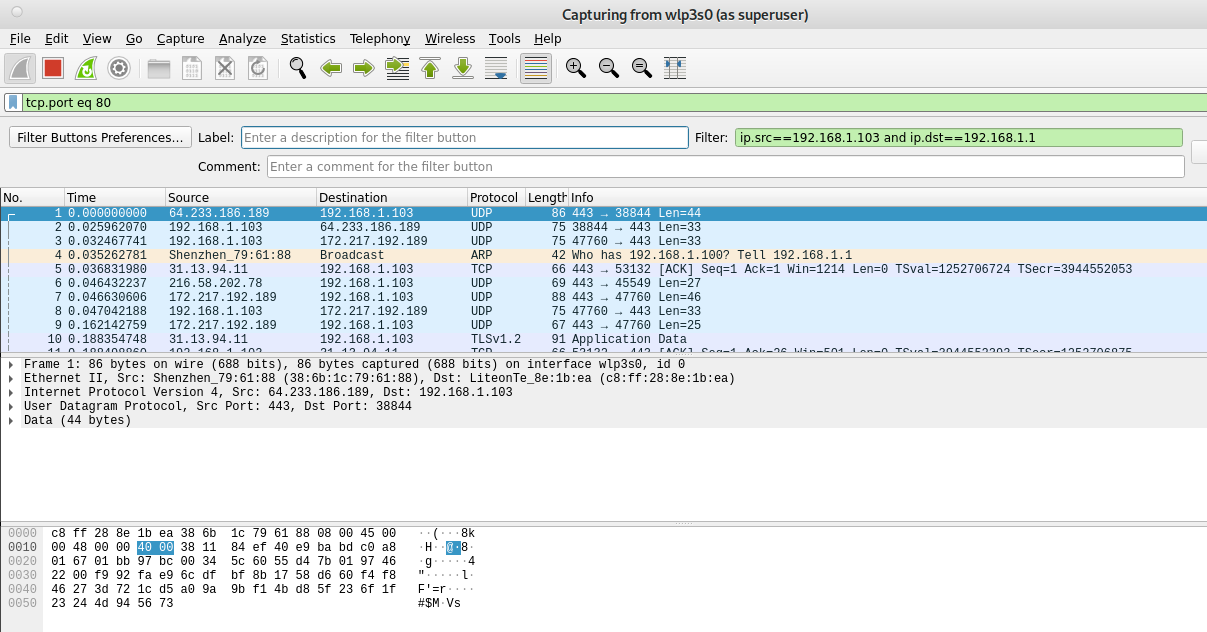
The first example shows how to capture packets belonging to a communication between two specific devices. As you can see in the screenshot below, the filter toolbar contains the filter “ip.src==192.168.1.103 and ip.dst==192.168.1.1” which instructs Wireshark to capture files whose source is the IP address 192.168.1.103 and whose destination is the IP 192.168.1.1.
The second example shows the filter “tcp.port eq 80”, which instructs Wireshark to show traffic to port 80, of course you can specify any other port.
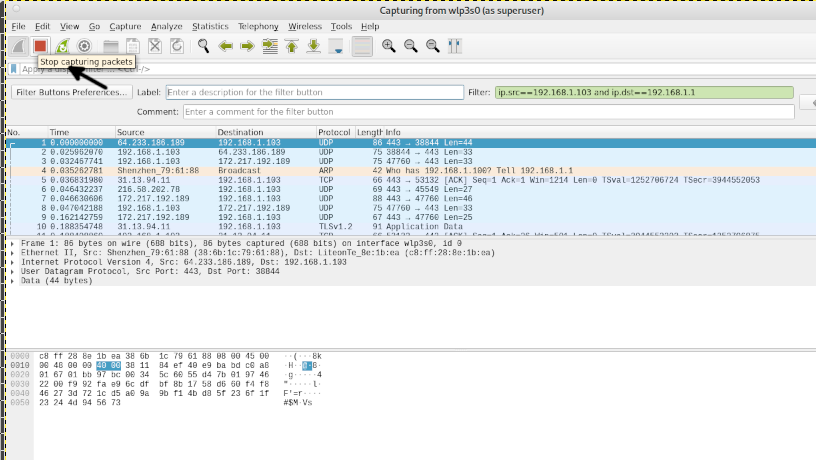
Once you finish capturing packets, you need to press the Stop capturing icon shown in the following screenshot.
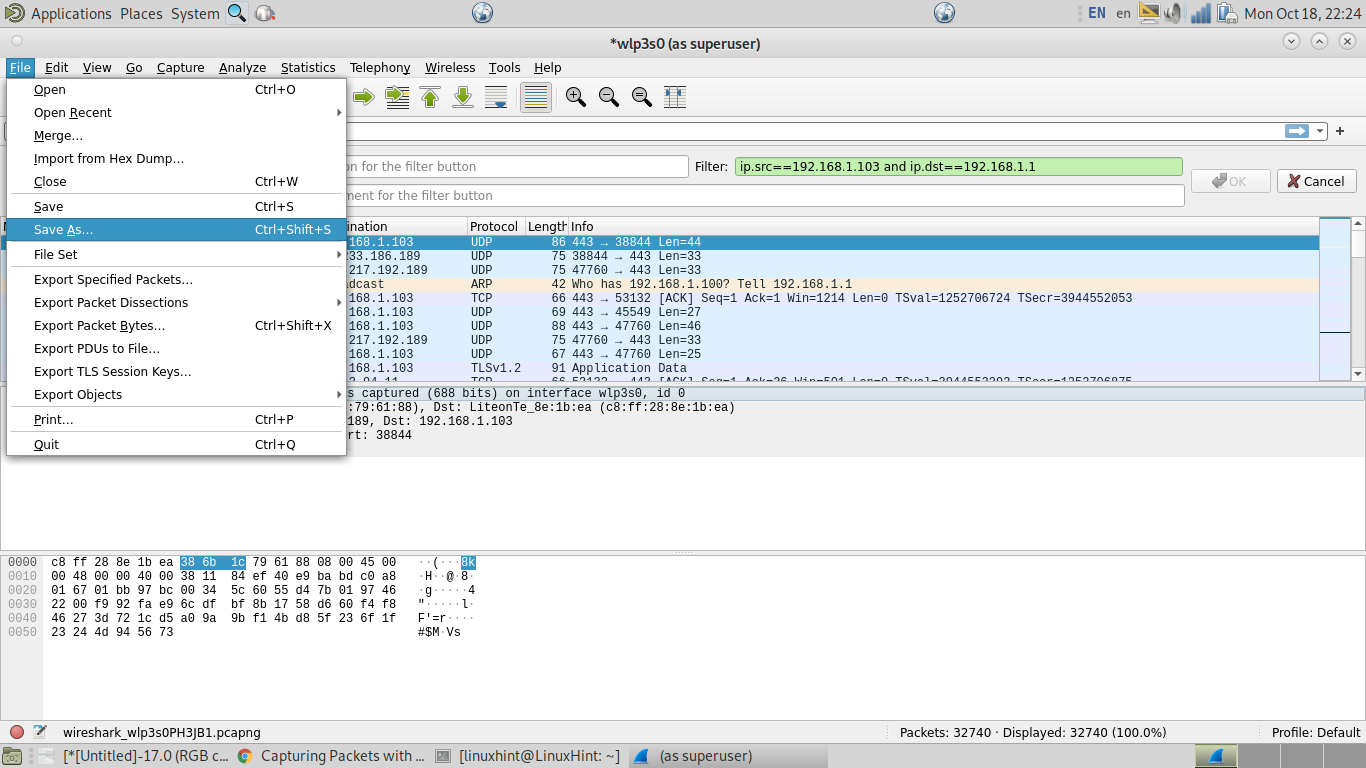
Then, once you stop capturing packets, you can save your captured file by pressing File>Save or File>Save as, as shown in the following image.
That’s all to start learning how to use Wireshark for now.
Conclusion
As you can see, installing Wireshark on Debian 11 is pretty easy and can be done using the apt command, with just a single command. Any Linux level user can install it, while it is mandatory for system administrators to know this or similar tools for network analysis. Wireshark is a very flexible tool which allows users to easily capture and analyze packets. In real scenarios Wireshark was useful to detect anomalies in network traffic. Wireshark can be also used to sniff traffic, both hackers and system administrators looking for bad traffic, need to know how to implement this tool.
Thank you for reading this tutorial showing how to install and get started with Wireshark on Debian 11. I hope this was useful to you. Keep following Linux Hint for additional Linux tips and tutorials.