This article will show you how to install Windows Exporter on a Windows computer and monitor it with Prometheus. So, let’s get started.
Table of Contents
- Pre-requisites
- Downloading Windows Exporter
- Installing Windows Exporter
- Adding Windows Exporter to Prometheus
- Monitoring Windows with Prometheus
- Conclusion
- References
Pre-requisites
To monitor a Windows computer with Prometheus, you must have Prometheus installed on your computer. You also need to have the Prometheus Windows Exporter installed on your Windows computer.
If you need any assistance in installing Prometheus on Ubuntu 20.04 LTS, you should read the article How to Install Prometheus on Ubuntu 20.04 LTS.
Downloading Windows Exporter
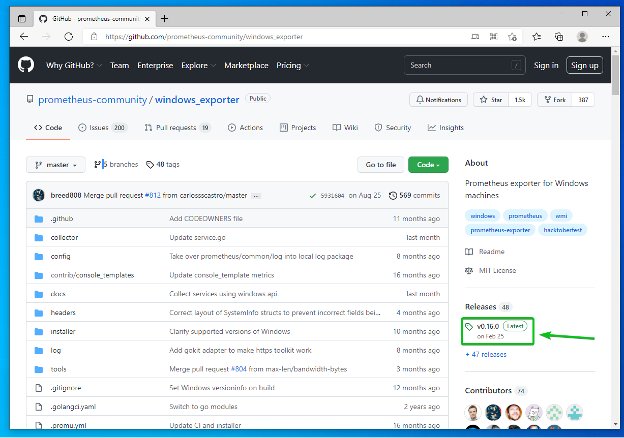
To download Prometheus Windows Exporter, navigate to the GitHub page of Prometheus Community’s Windows Exporter from your favorite web browser.
Once the page loads, click on the Latest release (v0.16.0 at the time of this writing) of Windows Exporter from the Releases section as marked in the screenshot below.
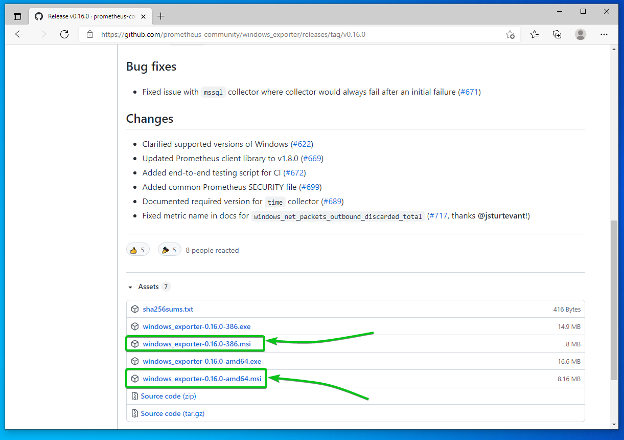
Scroll down to the Assets section. You have to download the correct version of the Windows Exporter installer for your computer from here.
If you’re running a 32-bit Windows operating system version, click on the windows_exporter-*-386.msi link.
If you’re running a 64-bit Windows operating system version, click on the windows_exporter-*-amd64.msi link.
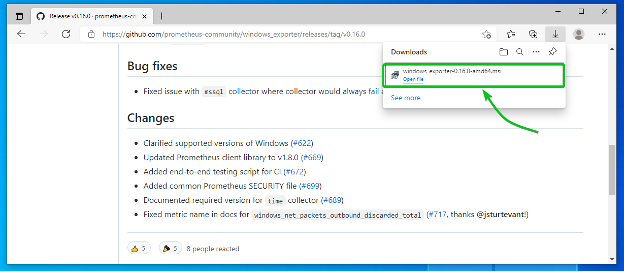
Windows Exporter installer should be downloaded.
Installing Windows Exporter
In this section, I will show you how to install Windows Exporter on a Windows computer.
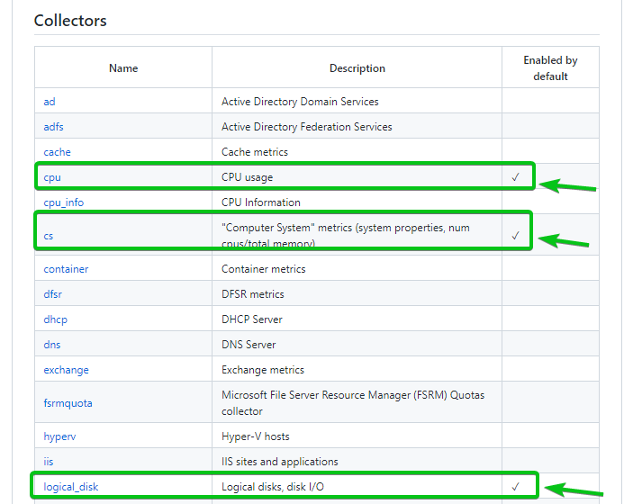
There are many collectors in Windows Exporter, and each of them is responsible for exporting specific information. You can get a list of the supported Windows Exporter collectors in the Collectors section of the Windows Exporter GitHub page.
Some of the collectors will be enabled by default, and some of them will be disabled by default, as you can see in the Collectors section of the Windows Exporter’s GitHub page in the screenshot below. I will show you how to enable the non-default collectors as well.
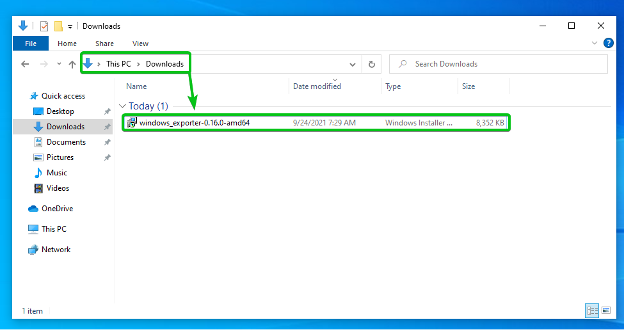
The Windows Exporter installer should be in the Downloads\ folder of your User’s data folder.
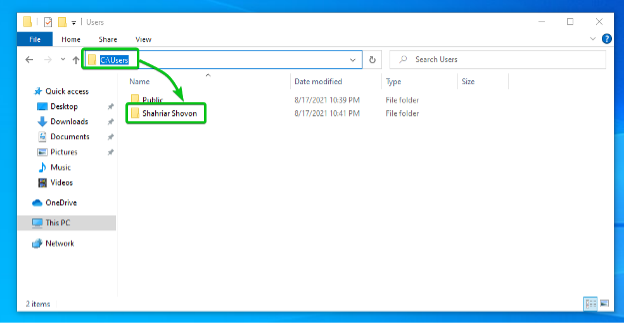
The Downloads\ folder should be in the path C:\Users\<USERNAME>\Downloads. Replace <USERNAME> with the username of your Windows operating system.
In my case, the Downloads\ folder path is C:\Users\Shahriar Shovon\Downloads
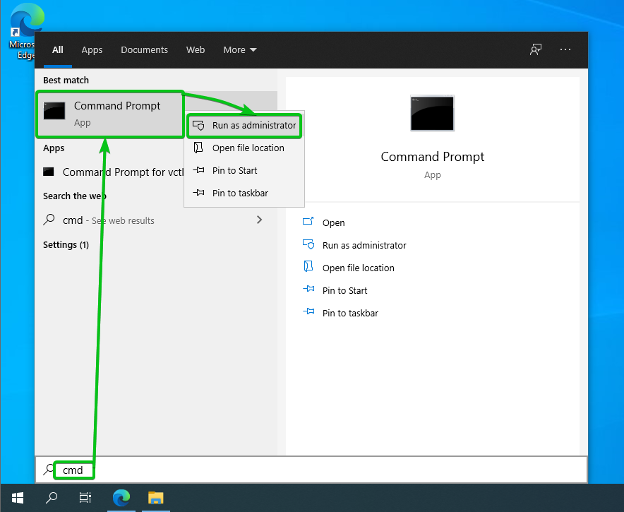
Now, search for the Command Prompt app, right-click (RMB) on it, and click on Run as administrator as marked in the screenshot below.
Run the following command to navigate to the Downloads/ folder of your computer.
NOTE: Make sure to replace <USERNAME> with the username of your Windows computer.
To install Windows Exporter and enable only the default collectors, run the following command:
To install Windows Exporter and enable only the default collectors as well as the non-default memory collector, run the following command:
Windows Exporter should be running on port 9182 of your Windows computer.
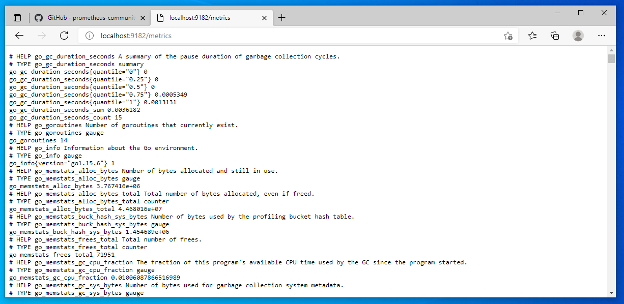
To verify whether Windows Exporter is working, open a web browser and visit http://localhost:9182/metrics. If you see the following output, then Windows Exporter is working.
Adding Windows Exporter to Prometheus
Once the Windows Exporter is installed on your Windows computer, you should be able to add it to Prometheus.
To add your Windows computer to Prometheus, you need to know the IP address of your Windows computer.
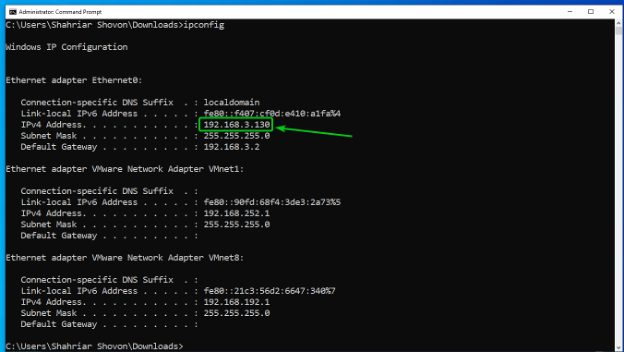
To find the IP address of your Windows computer, you can run the following command on the Command Prompt app of your Windows computer.
As you can see, the IP address of my Windows computer is 192.168.3.130. It will be different for you. So, make sure to replace it with yours from now on.
Now, open the Prometheus configuration file /opt/prometheus/prometheus.yml with the nano text editor as follows:
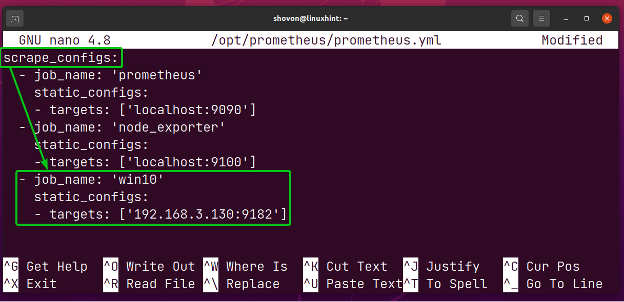
Type in the following lines in the scrape_configs section of the /opt/prometheus/prometheus.yml file. Make sure to replace the IP address 192.168.3.130 with the IP address of your Windows computer.
static_configs:
- targets: ['192.168.3.130:9182']
Once you’re done, press <Ctrl> + X followed by Y and <Enter> to save the /opt/prometheus/prometheus.yml file.
For the changes to take effect, restart the prometheus systemd service as follows:
To access the Prometheus web interface, you need to know the computer’s IP address where you have installed Prometheus.
You can run the following command on the computer where you have Prometheus installed to find its IP address:
In my case, the IP address of the computer where I have Prometheus installed is 192.168.3.149. It will be different for you. So, make sure to replace it with yours from now on.
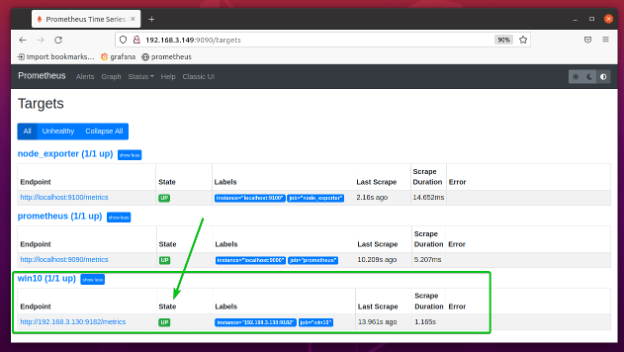
Now, visit the Prometheus Targets page at http://192.168.3.149:9090/targets from your favorite web browser, and you should see that the win10 target is in the UP state. It means that Prometheus can scrape stats from the Windows computer using Windows Exporter.
Monitoring Windows with Prometheus
To monitor your Windows computer with Prometheus, visit the Prometheus Graph page at http://192.168.3.149:9090/graph from your favorite web browser.
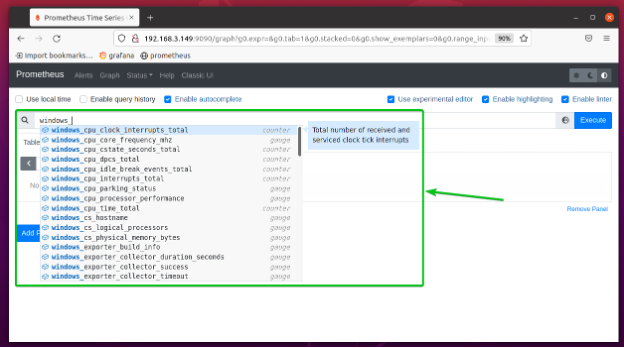
Type in the expression windows_ and you should see a list of all the Prometheus Windows Exporter metrics as in the screenshot below.
Let’s monitor the download speed of the Windows computer with Prometheus as an example.
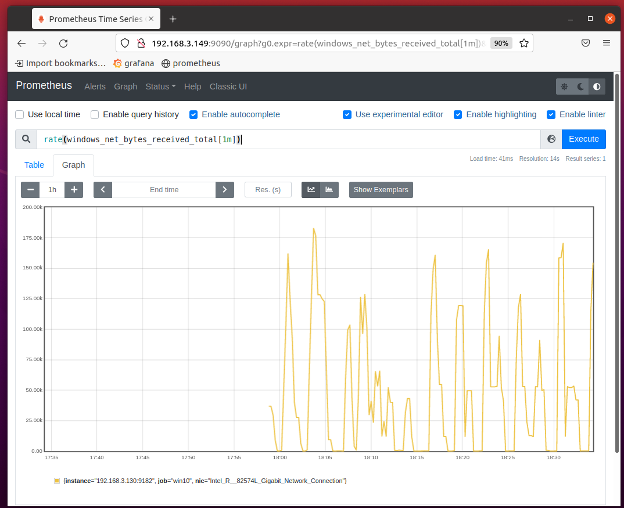
To monitor the download speed of your Windows computer, run the expression rate(windows_net_bytes_received_total[1m]).
You should see a graph of the download speed of your Windows computer, as shown in the screenshot below.
To find the available metrics of each of the collectors and what each of the metrics does, check the Collectors section of the Windows Exporter GitHub page.
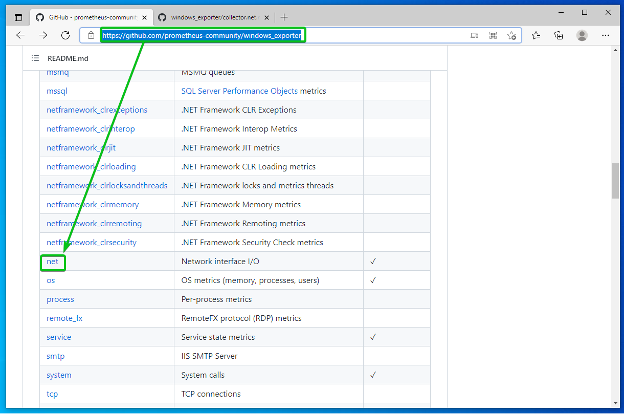
For example, to find the available metrics of the net collector, click on the link net from the Collectors sections of the Windows Exporter GitHub page as marked in the screenshot below.
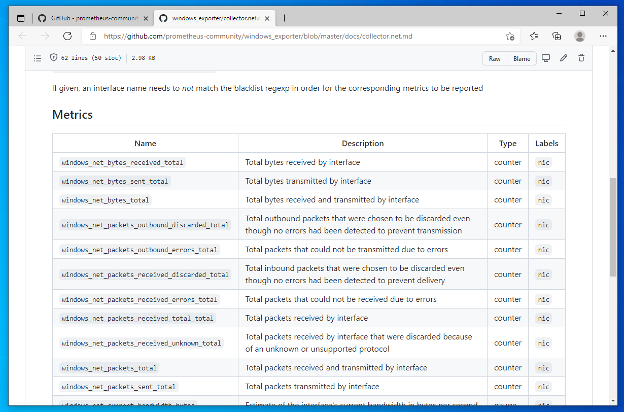
All the available metrics of the net collector, along with a short description of each of the metrics, should be listed in the Metrics section as marked in the screenshot below.
Conclusion
In this article, I have shown you how to download and install Windows Exporter on Windows. I have also shown you how to add Windows Exporter as a target on Prometheus. I have shown you how to monitor Windows with Prometheus as well.
References:
[1] prometheus-community/windows_exporter: Prometheus exporter for Windows machines
[2] How to Install Prometheus on Ubuntu 20.04 LTS

