All Linux distributions come mostly with top utility pre-installed. The top command shows real-time processing activity on your Linux computer, as well as tasks managed by the kernel. It will display the CPU and memory usage, as well as other information such as running programs. This may assist you in taking the appropriate action.
You can utilize the “Batch Mode” option to transfer top command outputs to other applications or a file. The top would not take inputs in this mode and will continue until the number of iterations you specify with the “-n” command-line parameter is reached. You must correctly grasp the result of the top command if you would like to resolve any performance problems on the Linux server. This article explains how to use the top command in batch mode to keep a closer eye on your system’s actions as an administrator.
Method to Use Batch Mode with Top Command
On an Ubuntu 20.04, we execute the commands indicated in this article. You can utilize any other Linux distribution as well. To perform our top command, we will use the Ubuntu Terminal. The Terminal can be accessed using the system dashboard or the Ctrl+Alt+T shortcut.
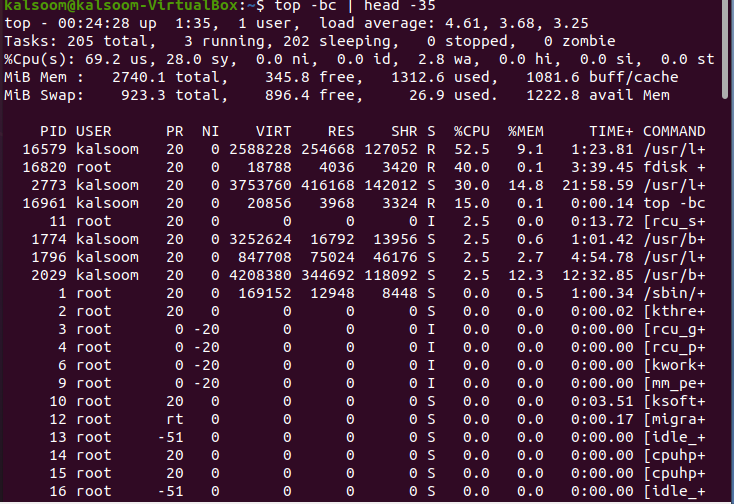
The top command sorts the data by CPU usage so that when you run the top command in the appended below batch mode, it does the same thing and prints the first 35 lines as specified in the following command.

You can check that 35 lines have been displayed in the output presented in the above screenshot. The “header” of the top gives extra details about the system’s present condition and usage; the overall amount of processes, the average load, as well as uptime.
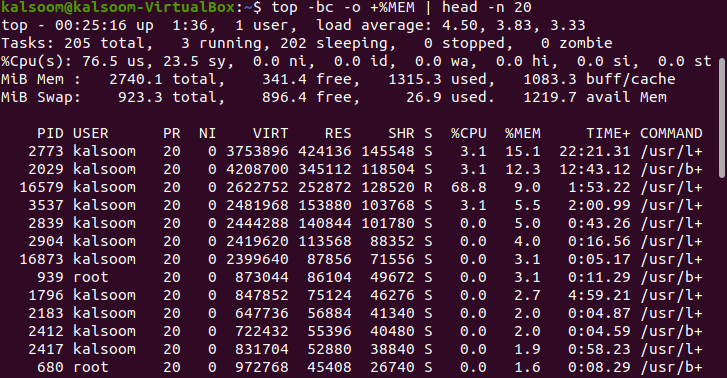
To check the results sorted in sequences of memory utilization by the process, we have to execute the affixed command.
This command will display almost 20 lines in the output and the number is also specified in the command as well.
All flags are described below that are used in the above command:
-b: Operate in batch mode.
-c: Prints the active process’s absolute path.
-o: To define fields for sorting operations.
Head: Display the very first portion of the files.
-n: Display the “n” number of lines. We have used “20” in our command.
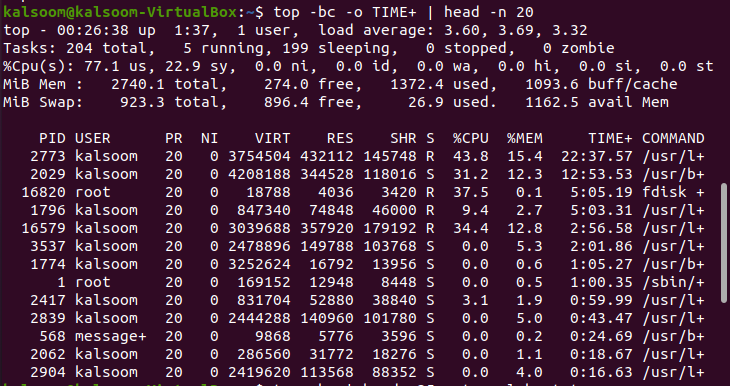
In batch mode, use the top command to arrange the data based on the process’ age. It displays the total amount of CPU time the process has consumed since it began. Execute the affixed command in the terminal.
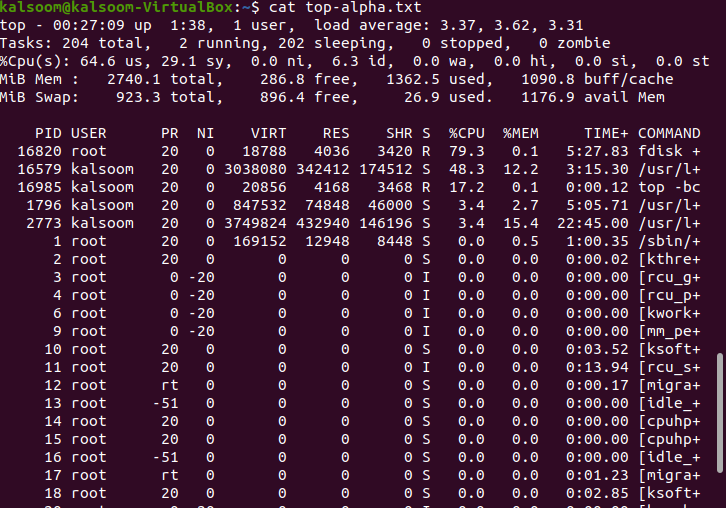
The output will vary from system to system accordingly. If you wanted to access the output of the top command with somebody for debugging purposes, use the following command to route the results to a file. We have utilized a file named “alpha.txt”. The choice of the file will be based on the user’s preference.
There will be no output of the above command. You can get the output by utilizing the following affixed cat command.
The output will be almost the same as displayed in the above screenshot.
Conclusion
In this guide, we have tried to explain the top command and its functionality in “batch mode”. We have implemented a few commands in Ubuntu 20.04 Linux system for your understanding. You can utilize them as per your work requirements. Above all, you should always run top in batch mode to route the results to a file or even another process. I hope the article would be quite easy for your understanding.


